Welcome to Alphatrends– Let’s Get Started!

Please Read These Guidelines in Full to Obtain the Most Value From Your Membership

Thank you for becoming a member of Alphatrends! The primary time frame for Alphatrends is swing trading. All of the ideas taught can be applied to any timeframe.

Every user is encouraged to “make the trade their own.”  This means to make choices based on what is right for you, your risk profile, and your personal objectives on each and every trade.  If you have questions about transitioning a trade to a different time frame, simply ask in the Alphatrends’ Forums. or during the Bi-Monthly Webinars

For all other administrative questions, please Contact Us Here.

A message from Brian Shannon, CMT, CEO & Founder of Alphatrends:

“The Alphatrends’ community has helped to train and mentor thousands of traders worldwide since 2005. The knowledge I have accumulated in my 30+ years of daily trading experiences is something I enjoy sharing. I have a passion for helping others, and I am glad that you have trusted me as an advisor and to nurture your success”.

Access the Alphatrends’ Dashboard for your paid Membership services!

To continue your subscription uninterrupted, there is no need to do anything. You will be automatically billed at the end of your current subscription (trials included) until you cancel your subscription. To CANCEL your subscription, you will need to go to ‘My Account‘ in the Dashboard, and then click on “My Subscription”. To review and/or change any information about your membership, billing, subscription, etc. click on the ‘My Account‘ tile in your Dashboard.

What Is Brian’s Posting Schedule For Each Video?

All videos can be found on the Alphatrends’ website homepage under the tab “Market Updates“, or by going to your “Dashboard” and clicking on the corresponding tile.

Alphatrends’ Discord Channel (Premium Members Only)– Get access to Alphatrends’ New Discord channel to connect with Brian and other members.

Stock Trade Ideas Video (Premium Members Only)– These detailed videos are about the low-risk, high-probability stock setups and what levels to watch. The videos are posted daily between 5:00 PM – 7:00 PM EST, so keep an eye out for this post (under Stock Trade Ideas Video & Webinar) to formulate your trading plan for the following day.  Monday Stock Trade Ideas Video Updates are available by 7:00 PM EST on Sunday.

Mid-Day Stock Market Video Updates (Premium Members Only) – These videos are posted by 11:00 AM EST.  This video is designed to keep you updated on our Stock Market Trading Ideas and the current performance of the market. This is a very important video so do not miss it! The Mid-Day Stock Market Video Updates and the End-of-Day Stock Market Video Updates are the only videos when swing trade stops will be adjusted.

End-of-Day Stock Market Analysis Video (All Members) – These videos are available by 4:30 PM EST.  They are designed to give an overall analysis of the markets. This is an important video to understand what’s going on in the market as a whole, and to formulate your plan for the following day.

LIVE Webinars and Recordings (Premium Members) – The LIVE Webinars are conducted every other Monday at 5:00 PM EST. They include an hourly presentation by Brian Shannon followed by a Q&A session for members to learn, collaborate and ask questions. If you have questions, you would like Brian to answer during the Live Webinar, please send them to 1bshannon@gmail.com. All Webinars are recorded and posted immediately after the live session. The next webinar date is posted at the top of the Alphatrends’ website homepage (orange banner/header).

Alphatrends’ Forums

The Alphatrends’ Forums provide direct communication with Brian Shannon, and other members of the Alphatrends’ community.  Please post your comments or questions under the correct subject within the Forums. In addition, please try to be concise as possible, as Brian will be able to answer you quicker. Brian will answer your questions within 24 hours of regular US market hours. The next webinar date is posted at the top of the Alphatrends’ website homepage (orange banner/header).

As for individual stock reviews, Brian only addresses that topic in the Forums and in the live Bi-Monthly Webinars, which are held every other Monday at 5:00 PM EST.

If you are interested in one-on-one mentoring, please Contact Us Here and we will accommodate your request.

If you have questions about your account, membership, billing, etc., please send an email to support@alphatrends.net or Contact Us.

I Want Your Stock Picks & Trade Ideas — Where Do I Find Them?

Every evening Brian will post new Trade Ideas with the title “Stock Trading Ideas For [DATE]” for the following trading day.  Premium Members should view these stock picks to prepare for the next day and to help formulate your trading plan.

I Am A Total Beginner — What Do I Do?

No problem! Alphatrends offers Trading Courses for various levels of experience, to help educate and mold you into a successful trader.

Introductory To Trading Course

New to Trading? This is where to start!

View Course

Advanced Trading Course

This Course equips you with a solid foundation to become a successful trader.

View Course

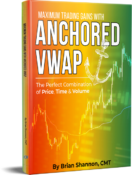
Maximum Trading Gains with Anchored VWAP

Brian Shannon’s most recently released (2023) book, Maximum Trading Gains with Anchored VWAP, quickly became the #1 Best Investment Strategy and Analysis Book on Amazon.  It is the result of decades of research and application by Brian from his own trading experiences. It builds on Shannon’s first book and is a great resource for both new and experienced traders and investors. Brian shows readers how to use the Anchored VWAP (AVWAP) to make better entries and exits, to time breakouts and breakdowns, and to set stop losses.

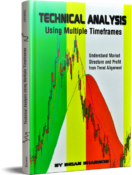
Technical Analysis Using Multiple Timeframes

In 2008, Brian Shannon released his in-depth book on technical analysis, and it is considered a must-read for beginning traders.  It is a complete, guide and textbook to understanding market structure and the psychology of price movement that includes:

– How to enter established trends at low risk, high profit levels.
– Recognize and profit from the cyclical flow of capital through all markets.
– Estimate profit potential in a trade with technical analysis.
– Correct stop placement for preservation of capital and maximization of winners and more!

Moving averages often act as an area of support in an uptrend or resistance in a downtrend. There are many times that a stock will blow right through an important moving average, leaving those who bought or sold short at that level with losses. Unless you are a systems trader, the correct way to utilize moving averages is as a visual reference point where there is the potential for support or resistance. Like any potential support or resistance area, a moving average gives us a reason to study price action more closely on a shorter timeframe for actual evidence that the supply/demand relationship is changing.
So, here is the answer to the question.. whether you use simple or exponential moving averages is irrelevant. The simple and exponential moving average will generally be quite close to each other and we will have plenty of time to observe the shorter term price action for evidence of trend change using either one. All the charts you see on Alphatrends are simple moving averages because that is what most people look at and I am most interested trying to understand the psychology of the majority of participants.

The official ideas have suggested stop levels which are often 2-3% from the entry price and not everyone is comfortable with stops so far away. The focus of Alphatrends is swing trade setups but those setups often provide excellent day trade opportunities. A day trader who is looking to hold the stock for the initial momentum in the trade will often want immediate action once the stock triggers and will recognize failure of that momentum to materialize well before a swing trader may wish to exit.
The alternative stop level is much tighter than the official stop level and will often times get triggered while the swing trade stop will keep a trader involved longer. It is up to you to decide how to use the stops in your own trading, sometimes it may even be appropriate to stagger your stops so that half of the position is exited on the tighter stop and the other stop will keep you in the balance. As with all the material on Alphatrends, it is hope that you can learn more about market structure and how various participants view the market, this information allows you to be more in tune and ultimately more profitable!

A solid understanding of basic technical analysis, including price patterns, is helpful but more important than remembering pattern names and identifying patterns is to understand the psychology of how those patterns develop and the motivations of participants which may trigger actionable price movement. The daily videos emphasize the psychology of participants and what may cause them to act at certain times for a deeper understanding of how price movement evolves.

If it is not clear whether you should be long or short it typically means that you should avoid trading the stock until the message becomes clearer. There are thousands of liquid individual equities and ETFs to trade, if you have a favorite stock to trade that is fine, but don’t forget that cash is the best position during uncertain times, it allows you to objectively observe the action and have capital ready to deploy when the lower risk trade is revealed by the market.

No, the primary timeframe we focus on is swing trade setups. While there is an active group of participants in the chat room who do day trade, the setups are always presented as swing trades ideas first, these stocks also happen to be great day trading ideas most of the time. It is up to you to decide which timeframe best suits your personality.

I am generally aware of the fundamentals of a company, but about 95% of my decision making is based on technical analysis. As a trader, timing is key and regardless of how good a story may appear. If price action doesn’t support the story I consider it too risky to be involved. As I like to say “Only Price Pays!” So the majority of our analysis should be focused on price action.

I think that analysis of volume for individual equities is much more important than the widely reported trading volume for the indicies. For equities I first look at volume as a measurement of liquidity to determine whether or not I want to get involved in the stock, anything less than 500K shares/day (20 day average) is typically where I cut-off my search for trade ideas.
Once I have found a stock of interest I like to see the general pattern of volume expanding in the direction of the primary trend followed by lighter volume as the stock experiences a corrective move in that trend. To me the volume represents the level of emotions (enthusiasm or disdain) the participants have for the stock. Increasing volume in a rally shows motivated buyers, while the lower volume corrective move indicates that there is a higher likelihood that the selling is simple profit taking and typically not the beginning of a reversal lower, the opposite would be true for a stock in a downtrend. I should point out that volume is a secondary measurement to price action but it is does provide us with a good insight into the collective psychology of the participants.
see www.onlypricepays.com for more

It is frustrating to be stalking a stock for entry and then have the stock gap above (long) or gaps below (for shorts) our anticipated entry level. There are times when the stock does a “gap and go” but there is typically a period where the stock
If a long trade opens more below S2 (reverse for short candidates, above R2) or at a level that will significantly increase our risk (based on the stop) we generally want to remove it from our watchlist quickly. This allows us to free up our energy to watch better risk/reward setups more closely, if the stock is one that you really want to own, don’t buy it while it is below vwap for that day, give it some time to heal before you consider buying. The best way to handle the stocks you still want to monitor is to set an alert for a price at a more reasonable level. For instance, if the stock looked like a trigger above 17.51 opens at 1740 and quickly moves down below 17.00 and the original stop was 16.85, it is NOT a better buy at 17.00 because it is “cheaper” when the momentum is lower there is no advantage to purchasing the stock early. Instead, when it is at 17.00 set an alert in your trading software to let you know when the stock is back to 17.30, this will put the stock back on your radar without having to distract your attention from other setups which may be more timely.

Remember, the official trade ideas are meant as swing trades and they are simply suggestions, it is never my intent to tell people what to do. When we first get involved in a trade and the stock moves quickly I like to take a little bit of profit quickly. Taking this small and quick gain accomplishes 2 things. First, it allows us to cover all of our transaction costs on the trade. Secondly, it lets us be in a “position of strength” on the remainder of the position and it doesn’t hurt as badly if the stock reverses course and stops us out. The most common level I suggest taking ⅓ of a position off is at or near daily R2 (longs) or S2 (shorts.) There is no perfect place to take a partial profit, but using the mathematically based pivot levels gives us a consistent method to reduce risk. If the initial sale seems early to you or just doesn’t seem worth it then, do what is right for you! Adjust the trade to your risk profile, holding time, goals, etc.. If you have a question, about alternative stops or levels to reduce exposure, simply ask!

I like to say “make the trade your own” because no two traders share the same; expected timeframe of a hold, financial resources or goals, risk profile, belief about how stocks trade, etc. The goal of the stocks presented on Alphatrends is to identify and clearly communicate “low risk, high probability” swing trade setups each and everyday. If you someone who likes to hold longer, or maybe you think the stops are too tight, then adjust them to a level which makes more sense to you. If you are a daytrader, then you should stick to that timeframe if it is what you are comfortable with. If you have questions then simply ask!

There are obviously a lot of components which factor into being consistently successful but a few of the more important traits shared amongst the best traders are: honest introspection and understanding of your personal psychology, quick thinking and able to be flexible as the market presents new information and a strong ability to be disciplined and follow our plan. For me I think that plan should be based around a solid understanding of market structure and a strong emphasis on risk management.

Candlestick charts are more visually appealing than bar or line charts, beyond that I personally pay close to zero attention to the patterns they form. It is my belief that if you want to understand the message that an individual candle, or a group of them, you can learn a lot more by analyzing the data on a shorter timeframe. The detail from shorter time frames allows for a much clearer interpretation of the action on the larger timeframe.

There really is no “one best timeframe” to analyze. In order to achieve a true edge in trading it is imperative to study price action on multiple timeframes. A minimum of three timeframes (long , short and intermediate term) should be consulted before entering a stock position. For swing traders these timeframes should be 1- daily chart of 150-200 days for the long term trend recognition 2- 30 or 65 minute timeframe for 30-50 days for risk/reward determination 3- 10/5 or even 2 minute timeframe for 2-10 days to fine tune entries For daytraders the three suggested timeframes are 30/65 minute for long term trend, 10/5 minute timeframe for risk/reward determination and 2/1 minute charts for fine tuning of entry.

It is smart to have an idea where the stock has the potential to go (this is the basis of the reward part of a risk/reward ratio) but remember that a price objective is just there as a guide to help us decide if taking a position is justified. Once we actually enter the trade we have only one job and that is to manage risk! There is an often mentioned phrase that “winners take care of themselves” and to a degree that is true but we cannot sit idly waiting for our target to be reached and fail to lock in profits or to let a winner turn into a loser. The market does not care where we think it should go, it is going to do whatever it does and we need to listen objectively to price action and adjust our position size and stops according to that message.

No, this is not an options trading service. I do not think that options are appropriate for a lot of participants but there are instances when they can be used to reduce risk. There are times when I will mention that I am considering options on a certain trade and fewer instances when I actually disclose an options trade I am in. Generally speaking, options are riskier to trade and should only be used by more experienced traders who fully understand the full risks. You are always welcome to ask about an option strategy you are considering and I will give you feedback on it as I would with an individual stock request.

No, like options, leveraged ETFs have their own unique risks which make them inappropriate for a lot of traders. The End of Day video focuses on the major index ETFs and the kevels mentioned for those markets can be used to trade the leveraged products, make sure you understand how daily compounding can dramatically affect the actual returns of these products versus the relationship you expect to the non-leveraged ETFs. This is an excellent source of leveraged ETFs http://bit.ly/Ztcu29

The official ideas are generally setups which show lower volatility and have more developed patterns which make finding actionable levels easier to identify than the watch list ideas. Official ideas are tracked (with fairly tight stop l
evels) for swing trades, while the watch list ideas are typically more volatile stocks or ones where the setup has not yet developed fully. We will often “stalk” watch list stocks for a few days and then they will become “official” ideas as the setups become clearer. There are often some very good trades which develop from the watch list ideas but they are best suited to day traders who can watch the action closely throughout the day. Both the official and the watch list ideas are monitored in the chat room throughout the day.

No and neither should you!  In fact, there are often stocks which I mention may be a good setup but that I won’t trade myself  because the personality of the stock does not match my own personality.  I know that stocks which look like “slower movers” are not ones I typically have patience with so I avoid those, but more patient Alphatrends traders often do quite well with them.  There are a wide range of stocks covered each day and that is done intentionally to offer up low risk/high potential ideas which fit your parameters.   Focus on the stocks which “speak to you” if you don’t understand or are not comfortable with the setup you will be more prone to making emotional (costly) decisions.

No two traders will trade a setup exactly the same and no one will trade all of the ideas mentioned. There are a lot of personal variables which will greatly vary the trading results between various participants (are you comfortable buying on the open or do you wait for a pullback, do you sell partial positions on strength, do you only trade stocks under $10/share or maybe over $50?) The primary goal of Alphatrends is to consistently bring you ideas which are profitable and at the same time do not expose you to large losses. We have all seen “track records” from various sites and when you study them further you realize that most of the time the results were unobtainable. Alphatrends stands on the quality of information brought to you each day in an educational format.

More Education

A Proven Trading Strategy To Help You Succeed

Welcome to the Alphatrends’ Community! It does not matter your current experience level; we will mold you into a profitable stock trader who is capable of winning in every market environment. Over the next week you will receive a series of emails which are designed …

How Not To Lose Your Shirt While The Market Takes A Dive

Don’t Lose Your Shirt/Capital When the Market Takes a Dive By now you have taken a look at the Alphatrends site, do you have any questions about the format the material is presented or about any of the concepts you have encountered so far? Send …

Understanding Market Structure

Understanding Market Structure The “Understanding Market Structure” infographic you received a couple of weeks ago (also LINKED HERE) is packed with useful information designed to help you obtain a better understanding of market structure and equity money flows. Once you truly understand the cyclical …

The Biggest Mistakes Many Traders Make

Three of the biggest mistakes we see traders make, you are probably guilty too! We hope that you are learning and earning from your free trial to Alphatrends. Below is a short discussion of some of the biggest mistakes we have observed traders make. Avoiding …

Money Management vs. Risk Management – Which Makes You More Money?

Money management vs. Risk Management- Dont understimate either! Have you ever found “the perfect setup” with a stock? A stock which looks like it has everything going for it, strong fundamentals, in an industry you understand, along with a great looking chart… I have personally …