
Here is the process I consider for a potential swing trade using an actionable trade idea for Monday. See important information about earnings at the bottom!
Start with a the daily chart for idea generation
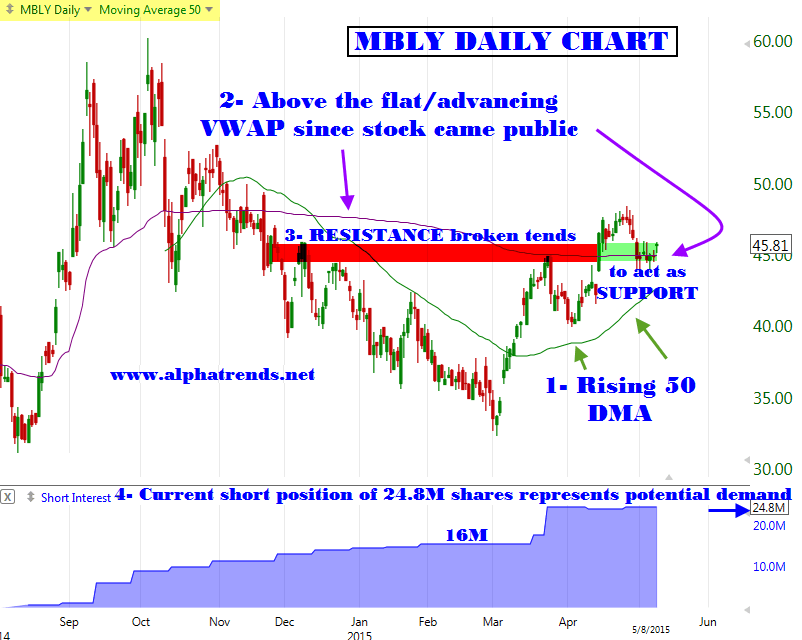
The chart below of Mobileye $MBLY shows the trading history since the company first came public.
1– You can see that the stock is trading above the rising 50 day moving average (green line) this simple trend recognition tool tells me that the buyers are in control of the daily trend and that the stock should be considered “innocent until proven guilty.” That doesn’t mean just buy it blindly, it means it is a good candidate to examine on a shorter timeframe for a potential LOW-RISK entry.
2– The purple line on the daily chart is the Volume Weighted Average Price (VWAP) since the stock came public, it is at approximately 45.11. The average price of the stock since it came public is below the current price which means the average long is in a winning position and feeling good about holding the stock. It also tells us that the average short seller is in a losing position and may be feeling anxious, see #4 below.
3– Resistance broken tends to act as support. This is a basic concept of technical analysis and you can see that the prior “band of resistance” is now acting as a level of support.
4– The number of shares sold short and not yet covered stands at 24.8 million as of the most recent short interest report. You can see that this number has increased from 16 million as of mid-March. How would you feel if you shorted at those lower levels? This is a potential source of demand if the stock rises and the short sellers position begins to hemorrhage more losses. You “cut losses” in a short position by buying back shares, which obviously adds demand and has potential to help drive prices higher.
Know your timeframe
For a swing traders timeframe (up to a couple of weeks) the timeframe to strategize and determine if your targeted stock is setting up with a favorable risk/reward ratio is a 30-minute chart. When I refer to a 30-minute chart it means that each period (length of candle) represents 30 minutes of trading activity. The chart below shows the intraday trading of $MBLY since March 19 of this year.
On the chart, you can see the blue moving average (a 65 period or 5 DAY) as a reference for the intermediate term trend. There is no other information on this chart besices price because ONLY PRICE PAYS, see www.onlypricepays.com
When we look to make a swing trade purchase we want to buy a higher high above a flat to rising 5 day moving average. For MBLY the higher high will reveal itself to us if/when the stock trades above last weeks high of 46.06 (above the red dashed line). Trading above this level will create the beginning of an uptrend on the intermediate term trend. Our job is to purchase above this level and then to manage risk.
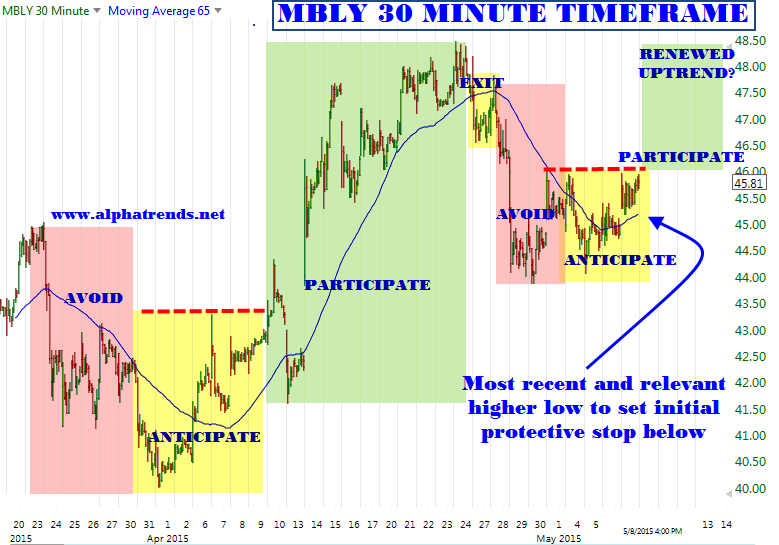
Our initial risk management consideration is to protect ourselves from a large loss, so we look for a reasonable place to set an initial protective stop. If we are buying because we expect the trend to continue (a tenet of technical analysis is “a trend, once established is more likely to continue than reverse”) then our stop should be based on the very definition of an uptrend. An uptrend is defined as “higher highs and higher lows.”
On the 30 minute timeframe, where we make our buy decision, we then define the “most recent and relevant higher low” the relevant part is in relation to our timeframe as swing traders. The blue arrow shows the low from last Friday of 45.19 to be that low to protect your position with a stop below. If the stock drops below 45.19 after the 46.06 high is breached then our definition of trend no longer exists for the timeframe we have chosen to engage the trade. Why on earth would you continue to hold if the definition of trend is no longer valid?
If the stock continues to move higher our job then switches to active risk management, which means we trail our stops up under the higher lows as the stock progresses higher.
IMPORTANT Earnings are due out Monday morning at 8:30 AM. This is a potential catalyst for a large gap in either direction. I chose to post this idea prior to the earnings for educational purposes. If the stock gaps significantly above the desired entry then the perceived risk/reward will change completely and the decision whether to trade the stock and at what price will likely be different from what is outlined above. The more advanced concepts of handling the gap are something which will be covered along with other trading strategies in the upcoming Stock Trading Course which begins on May 26.