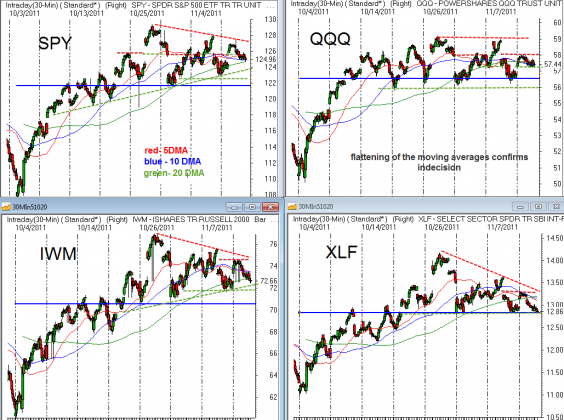
Trading volume is very light once again and markets are stuck in ranges above key support levels. The blue horizontal lines represent the volume weighted average price from the October low through current prices.
You can see the $XLF has struggled with that level the most, but prices remain above that level which is also critical horizontal support ~12.80 Breaking below 1280 and staying below would likely cause weakness in the broader market. If however we get a break below and quick recovery it could be the catalyst for a squeeze. Stay on your toes, anything can happen here.


