

MDY- Weekly chart (click to enlarge)
I have been warning of potential trouble for the S&P 400 Mid-cap index ETF (MDY) in my videos over the last month or so and now the index appears to be on the verge of breaking down. If this index (which led the market higher) does break lower, there could be severe negative consequences for the overall market. This index represents the biggest threat to the overall health of the market right now and you should keep a close eye on it here. The weekly chart shown above shows the index has had a negative volume pattern since it began its decline in early May. As the index drops, the volume has been increasing. While the index has rallied over the last 8 weeks, the volume has been diminishing, which means the buyers lack conviction. Even more recently is the increased volume of the last 2 weeks as the market churned below all of the longer term moving averages. Big volume without further upside equals distribution. If buyers do not come in and rescue this index this week, there could be a quick and severe selloff that follows, be careful….
MDY daily chart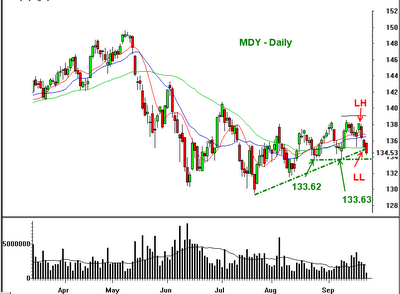
The uptrend line on the daily timeframe has been broken and the index has made a lower high and a lower low, but that is only enough to get me into the “extremely cautious” camp. In order for me to become outright negative and convinced of a real selloff materializing, it would take a move (close) below the recent lows at 133.62, 133.63. Closing below that support level would get me very concerned that a longer term selloff has begun. This is a good time to be very careful. Short term, I think we can breath a little bit easier if the MDY can close above 136.50.