

End-of-Week Market Analysis – March 13, 2026
This week’s market analysis from Brian Shannon highlights a continued shift toward a more defensive trading environment. While the headline decline in the S&P 500 may not appear extreme, the underlying structure tells a different story – weakening trends, failed rallies, and increasing downside pressure across major indexes and leading stocks. ⚓
Market Overview
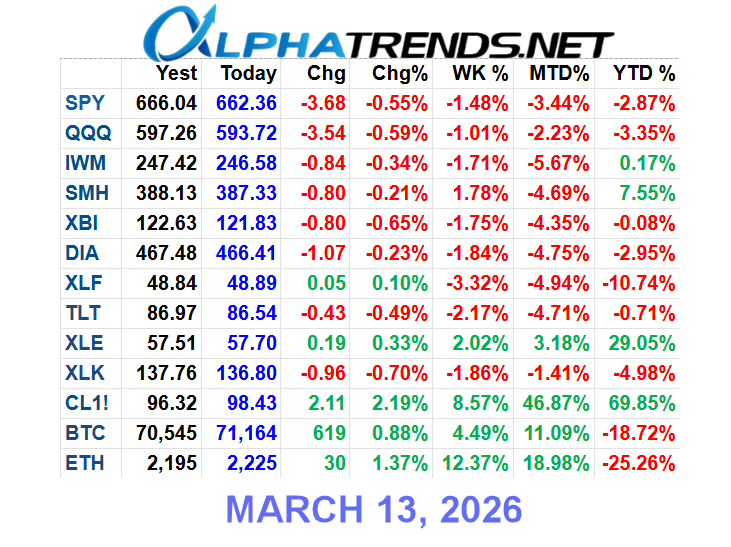
The S&P 500 declined approximately 1.5% on the week, closing at its lowest level of the year. Financials remain one of the weakest sectors, while energy – particularly oil – continues to show strong upside momentum. Crypto saw a short-term bounce, but remains structurally weak.
The key takeaway is not the percentage move, but the structure beneath it. Markets continue to show a clear pattern of lower highs and lower lows, reinforcing a bearish environment rather than a bullish one.
Energy, Gold, and Crypto
Oil remains a dominant force in the market. After pulling back, it found buyers above its anchored VWAP from recent highs, signaling continued control by buyers. Strength in oil continues to create pressure on equities.
Gold has weakened, breaking below key anchored levels including both the week-to-date anchor and levels tied to prior highs and lows. This opens the possibility of a deeper test toward lower anchored support zones.
Bitcoin bounced during the week but remains below a declining 50-day moving average and continues to face rejection near the year-to-date anchored VWAP. This repeated failure reinforces the idea that sellers remain in control of the broader trend.
Short-term trading opportunities may exist, but the bigger picture remains messy and requires caution.
S&P 500 and Market Structure
The S&P 500 is now at its lowest closing level of the year and appears likely to test the 200-day moving average. A deeper move toward anchored support levels from prior major lows is also possible as selling pressure continues to build.
The structure is clear: lower highs, lower lows, and repeated rejection at declining 20-day and 50-day moving averages. This is not a market environment where dip-buying strategies are likely to perform well.
Early in the trading session, a rally into the declining 5-day moving average and the week-to-date anchored VWAP provided a clear warning signal. Once price failed and broke back below intraday VWAP levels, sellers regained control and maintained it throughout the day.
This reinforces an important principle: failed rallies in weak markets often present higher-probability opportunities than chasing strength.
NASDAQ, Russell 2000, and Broad Market Trends
The NASDAQ remains below declining 20-day and 50-day moving averages as well as the year-to-date anchored VWAP. It is also hovering just above its 200-day moving average, increasing the likelihood of a test of lower support levels in the coming weeks.
The Russell 2000 continues to underperform. After breaking down from a previously discussed triangle pattern, it has maintained a pattern of lower highs and lower lows. Small-cap weakness is often a sign of a broader risk-off environment.
Across major indexes and sectors, the message is consistent – price is below declining moving averages and below key anchored levels. This is not a healthy environment for aggressive long exposure.
Semiconductors and Leadership Stocks
Semiconductors, long considered a leadership group, are beginning to weaken. A recent attempt to push higher failed, and the current structure is starting to resemble a potential head-and-shoulders pattern.
Although the group remains above the 200-day moving average, a pullback toward that level could represent significant downside from current prices.
NVIDIA was rejected near its declining 50-day moving average and the year-to-date anchored VWAP. Despite a bounce from the 200-day moving average, the stock is no longer showing strong upside momentum and may test lower support levels in the near future.
Biotech and Market Distribution
Biotech stocks are showing signs of distribution, with a pattern of lower highs and repeated tests of support. This behavior suggests increasing selling pressure as sellers step in at progressively lower prices.
Repeated tests of support often lead to breakdowns. Traders should avoid complacency and recognize that weakening structure can precede larger moves lower.
While the longer-term weekly trend may still appear intact, shorter-term timeframes are showing deterioration. For active traders, these shorter-term signals are often more actionable.
Bonds and Risk Management Lessons
Bonds experienced a sharp reversal after a prior breakout. This provided a clear example of disciplined trade management using moving averages and trend structure.
A structured exit strategy based on higher lows and key moving averages would have gradually reduced exposure before the larger decline. This reinforces the importance of managing trades in stages rather than attempting to exit at the exact top.
Once a trend breaks and price returns to prior lows, it is often best to step aside and wait for new structure to develop.
Mega-Cap Stocks and Individual Names
Many large-cap stocks continue to struggle. Apple appears to be heading toward a test of its 200-day moving average, while Microsoft remains below key moving averages, indicating ongoing weakness.
Netflix has shown some relative strength on shorter timeframes, but remains below the 200-day moving average, making the broader structure less reliable for sustained upside.
Sandisk showed a strong bounce but remains within a larger range, while Tesla continues to display a pattern of lower highs and lower lows with declining moving averages. A breakdown toward lower anchored levels would not be surprising.
Key Trading Takeaways
The most important message from this week’s analysis is to respect market conditions. This is not a bull market environment, and applying bullish strategies in a bearish structure can lead to consistent losses.
Rallies should be viewed with skepticism when they occur below declining short-term moving averages, particularly the 5-day. Brian emphasizes repeatedly that rallies in this context are not to be trusted until proven otherwise.
Instead of chasing strength or buying dips, traders should focus on understanding structure, identifying key levels such as anchored VWAP and moving averages, and defining risk before entering any trade.
Above all, discipline and patience remain essential. When markets are trending lower, capital preservation becomes the primary objective.
If you want daily insights and real-time market structure analysis from Brian Shannon, explore more from Alphatrends below:
Follow Alphatrends on X for subscriber analysis
Learn more about Alphatrends Premium Membership