

End-of-Week Market Analysis – Week Ending February 13, 2026
This article How to Choose the Right Timeframe for YOU written with Kyna Kosling has received a lot of positive feedback, I think you will like it too.
If you have time Sunday morning, tune into what is likely to be a great discussion on "Spaces" on X at 11am ET with myself and veteran money manager, George Noble.
Here is a little bit about George.
George Noble is a veteran money manager and hedge fund pioneer with over 40 years of experience, known for his roots at Fidelity and his outspoken views on market "bubbles."
He is currently the Managing Partner of Noble Capital Advisors and hosts the podcast Market Talk with George Noble, where he frequently discusses macro trends and technical analysis.
Early Career and Fidelity Success
Noble gained prominence in the 1980s as a protégé of legendary investor Peter Lynch.
Fidelity Overseas Fund: In 1984, he was chosen to launch and manage Fidelity’s first international fund. Under his leadership until 1991, it became the top-ranked international fund in the country.
Performance: During his tenure, the fund famously outperformed nearly all of its peers, establishing Noble as a top-tier institutional manager.
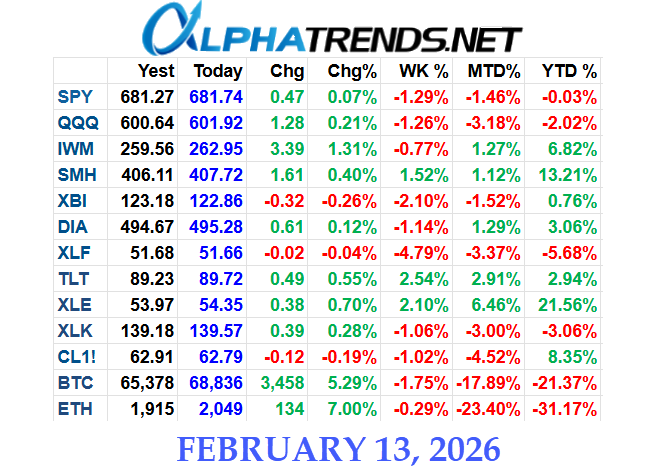
In this end-of-week market analysis, Brian Shannon reviews the major indexes, leading stocks, fixed income, and crypto using a structured technical approach built on moving averages, anchored VWAP, price structure, and disciplined risk management. This recap highlights the key themes from the video so you can approach the coming week with clarity and defined risk. ⚓
Technology Leaders and Mega-Caps
Apple (AAPL) failed to produce a meaningful bounce, and sellers remain dominant. Until buyers reclaim control and price improves relative to key moving averages and anchors, there is no technical edge on the long side.
Microsoft (MSFT) is stabilizing near a trend line, but it continues to trade below major anchored levels and declining moving averages. That keeps the intermediate trend vulnerable unless proven otherwise.
Amazon (AMZN) and Netflix (NFLX) show broken or very weak structures. The message is clear – avoid dip-buying and instead focus only on strength after buyers clearly regain control.
Palantir (PLTR) remains in a downtrend defined by lower highs and lower lows. Prior deep drawdowns often take time to repair, so patience and selectivity are critical.
Biotech Sector
Biotech is battling an anchored low and recently faced rejection at a declining 20-day moving average. Sustained trade below prior support opens downside toward roughly 116. With declining 5-, 20-, and 50-day moving averages, downside risk remains elevated until structure improves.
For traders, this is a reminder that when multiple short-term moving averages are sloping lower, rallies can often be sold rather than chased.
Energy
Energy remains in an uptrend characterized by higher highs and higher lows, holding above a rising 5-day moving average. For active trades, stops can sit under the most recent higher low. For longer holds, the 10-day or 20-day moving average may serve as a reference.
When a sector is trending, the goal is not prediction – it is disciplined participation with clearly defined exit levels.
Fixed Income and Bonds
Bonds broke above anchored resistance from the recent high, and the 50-day moving average is now rising. However, price may be short-term overextended, so chasing breakouts at extended levels increases risk.
Prior support around the 88–88.5 zone is a likely area of renewed buying interest if price pulls back. As always, location matters more than emotion.
Bitcoin and Ethereum
Crypto experienced large intraday swings but remains negative on the week and for the year. Both Bitcoin and Ethereum continue to trade below declining 20-, 50-, and 200-day moving averages, keeping them in technical downtrends.
A tradable long setup would require a higher low followed by a higher high, with risk defined beneath the most recent swing low. Until that structure forms, patience remains the higher-probability approach.
Volume, Moving Averages, and Trade Strategy
Volume often expands near turning points. Traders should look for volume surges to validate lows and highs rather than relying on price alone.
Trend bias by timeframe:
Short-term bias is defined by price relative to the 5-day and 20-day moving averages. Intermediate-term bias is shaped by the slope of the 50-day and its relationship to the 20-day. Long-term structure improves when the 200-day moving average is rising, but price below it signals elevated risk.
Anchored VWAP and anchored moving averages help define supply and demand zones. These reference points clarify where participants are likely to defend positions.
Overall stance remains defensive. Many groups continue to show lower highs and lower lows. Avoid buying dips in broken names. Instead, wait for buyers to regain control and then buy strength with predefined risk.
Plan for potential undercut-and-bounce patterns, but pre-plan stops and exit levels before entry. In crypto, require a higher low and higher high before committing capital. For semiconductors, the NASDAQ, and other leaders, focus on clearly defined key levels and size positions relative to measurable risk. For energy and other leading groups, anchor stops beneath recent higher lows or short-term moving averages and keep position sizing conservative.
Key Takeaways for the Week Ahead
The dominant theme remains discipline. Many large-cap leaders are not yet offering clean technical setups. Energy shows relative strength, bonds have improved but may be extended, and crypto remains structurally weak. The focus should stay on capital preservation, clear structure, and risk-defined entries.
This analysis is for educational purposes and is designed to reinforce process over prediction – trend alignment, location, volume confirmation, and structured risk management.
If you want deeper daily and weekly market structure breakdowns using anchored VWAP, moving averages, and objective risk management, explore more from Alphatrends:
Follow Alphatrends on X for subscriber analysis
Learn more about Alphatrends Premium Membership