


End-of-Week Market Analysis – April 17, 2026
This week’s market analysis from Brian Shannon highlights a constructive but selective environment, where strength is emerging in certain sectors while others remain mixed. The focus continues to be on price structure, leadership, and disciplined risk management rather than prediction. ⚓
Market Overview
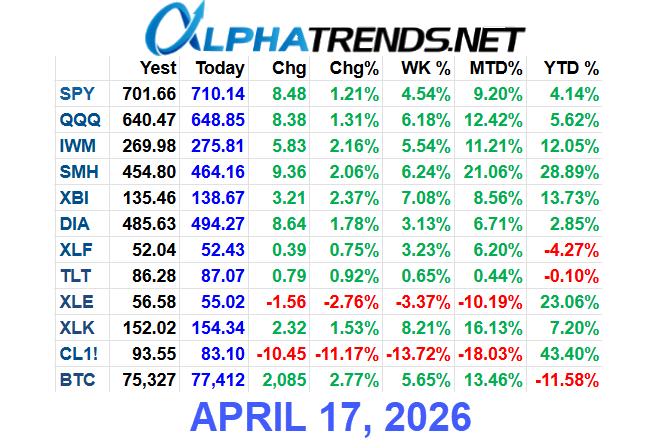
Following a volatile stretch, the market showed signs of stabilization and selective strength. The S&P 500 and NASDAQ continued to grind higher, supported by leadership in semiconductors and improving sentiment in select areas.
At the same time, not all sectors participated equally. Energy and certain commodities showed mixed behavior, while bonds remained under pressure. This reinforces the idea that traders must stay focused on individual market structure rather than broad assumptions.
Market Highlights
Semiconductors continued to lead the market, extending gains and reinforcing their position as the primary source of strength. Biotech showed signs of improvement during the week, while oil experienced a pullback after prior strength.
Bitcoin rallied but remains below key resistance levels, keeping its broader structure uncertain. Meanwhile, the Russell 2000 also pushed higher, supported in part by a gap-driven move earlier in the week.
Despite these gains, many energy-related stocks remain weak, particularly those trading below declining short-term moving averages.
Key Technical Observations
Oil is approaching an important resistance zone in the mid-80s range. The recent rally has retraced a significant portion of prior declines, making this area a key level to watch for potential supply.
Bitcoin broke out from a consolidation range but still faces resistance near prior highs. While short-term momentum has improved, the broader trend requires confirmation through higher highs and sustained support.
Major indices such as the S&P 500 and NASDAQ continue to display a constructive pattern of higher highs and higher lows on intermediate timeframes. Rising short-term moving averages support this trend, indicating that buyers remain in control.
Semiconductors remain the strongest group, continuing to make higher lows and lead market direction. In contrast, biotech shows more choppy behavior, with multiple moving averages converging and creating less clarity.
Energy-related stocks have struggled to maintain gains, particularly as short-term moving averages flatten or decline. This divergence between commodities and equities highlights the importance of evaluating each market independently.
Trading Strategy and Risk Management
Brian emphasizes that risk management remains the foundation of successful trading. Position sizing should be adjusted when entering extended markets, and stops should be placed based on recent higher lows for swing trades.
Traders are encouraged to operate with a mindset of “innocent until proven guilty” when the market is trending higher. However, when short-term moving averages begin to decline, the environment should be treated as “guilty,” requiring more caution.
Short-term entries should focus on low-risk opportunities, such as pullbacks to volume-weighted average price (VWAP) or reclaiming VWAP after a gap. Avoid chasing breakouts or extended moves, as these often lead to poor risk/reward outcomes.
Scaling into and out of positions allows traders to manage risk while maintaining exposure. Taking partial profits into strength and re-entering on pullbacks can improve overall trade efficiency.
Stock Example: ALHC
ALHC was highlighted as an example of a stock showing consolidation behavior. With average daily volume around 3.3 million shares and earnings approaching, it represents a situation where traders should be aware of upcoming catalysts while focusing on structure.
Clean consolidation patterns can provide opportunities if they resolve with strength, but risk must be clearly defined before entry.
Key Concepts to Understand
VWAP (Volume-Weighted Average Price) remains a critical tool for identifying low-risk entry points and measuring price acceptance. When price reclaims VWAP, it often signals improving demand.
5-Day Moving Average helps define short-term trend direction. A rising slope indicates bullish conditions, while a declining slope suggests increasing risk.
Higher Highs and Higher Lows define an uptrend and provide a framework for identifying support and managing trades.
Fibonacci Retracements can help measure the depth of pullbacks and identify potential areas of support within a trend.
Actionable Insights for Next Week
Traders should review open positions and ensure stop placement aligns with recent higher lows and key moving averages. Staying disciplined with risk management is essential, particularly as markets approach extended levels.
Watch key resistance levels in oil and monitor whether semiconductors continue to lead. Observing whether indices maintain their pattern of higher highs and higher lows will provide insight into the strength of the current trend.
Upcoming earnings events, such as ALHC, may introduce volatility. Traders should be prepared and avoid holding positions through events unless it aligns with their strategy.
Final Thoughts
The market is showing constructive signs, but participation remains selective. Strong leadership in semiconductors contrasts with weakness in other sectors, creating a mixed environment that requires careful stock selection.
The key is to remain disciplined, focus on price action, and manage risk effectively. By aligning trades with market structure and avoiding emotional decisions, traders can navigate both opportunity and uncertainty more effectively.
If you want deeper insights into market structure, anchored VWAP strategies, and daily trade ideas, explore more from Alphatrends below.
Follow Alphatrends on X for subscriber analysis
Learn more about Alphatrends Premium Membership