Weekly Stock Market Analysis
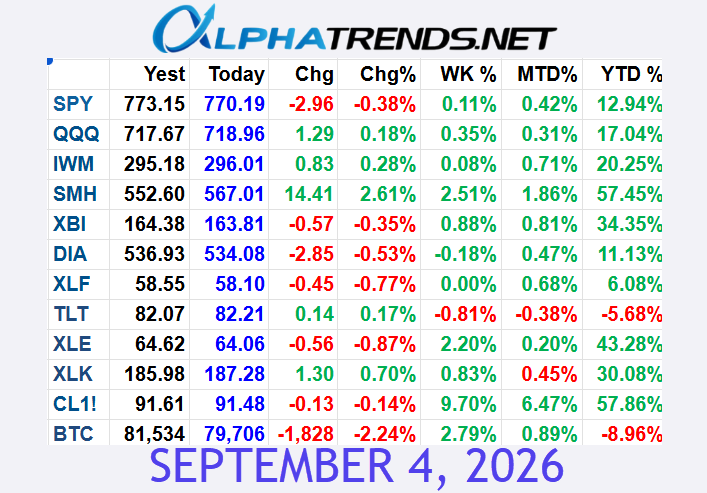
As we approach the end of the year, we’re looking at a trading schedule with full days on Monday, a half day on Tuesday, and a market closure on Wednesday. This holiday rhythm naturally causes a slowdown in trading activity, and today we’re witnessing a slight market pullback. Fortunately, it’s nothing too alarming.
Analyzing the Charts: S&P 500 Insights
Let’s delve into the charts and understand what’s happening. On Thursday, the S&P 500 met the declining 20-day moving average, as well as a previous support band. Today, we saw a gap downward, which continued into the trading session.
The market came down to the five-day moving average and significant anchor points from recent lows and the Federal Reserve’s guidance.
Looking Forward to Next Week
Thursday night, I outlined potential movements for today—a projection I shared with AlphaTrends subscribers and on Twitter. As we look ahead to next week, there’s a chance for recovery. If the markets can climb back, we might break through the current levels. However, it’s crucial to remain cautious as we’ve been below a declining five-day moving average. But that’s set to change first thing Monday morning as we shed this data from our calculations.
Moving Averages and Holiday Impact
Remember, when you observe a five-day moving average on a daily chart, you’re not actually viewing five full trading days—especially with the holiday-shortened weeks. Typically, you would only see this accurate picture at the close on the fifth day. Next Monday, it will reflect three and a half days plus five minutes first thing in the morning. For accuracy, I recommend using intraday data for a five-day moving average. This approach has proven advantageous over decades of trading experiences, as daily charts don’t capture short-term nuances effectively.
Market Recovery or Further Decline?
For the S&P to rebound effectively, we’d ideally break through the resistance band and continue climbing. On the flip side, if we encounter more weakness and remain below our five-day moving average, we may need to brace for a downward test towards deeper support levels like the September low anchor. Another possibility is a more significant slide into early next year, potentially reaching down towards the 570 range.
Preparing for January Pullbacks
Given the substantial gains, deeper pullbacks in January might be on the horizon. These pullbacks serve as a reset for the market, laying the groundwork for more normalized trading patterns as we usher in 2025. The Nasdaq’s trend of higher highs and lows faces a possible disruption. We’ve seen a lower high so far, without a corresponding lower low—that could change if Monday reveals more weakness. However, I wouldn’t shift to a bearish outlook unless we experience a new pattern of continued decline.
Russell 2000: Stuck in a Rut
The Russell 2000 faces declining five-, 20-, and 50-day moving averages, hovering around the anchor from August lows. A slide to the 215 level—where previous April lows and the proven 200-day moving average rest—would be unsurprising. This demonstrates a lower trend. If your aim was to capture a bounce in the Russell 2000, a stop should be placed appropriately as trends tilt downward. When dealing with declining moving averages, avoid getting misled by transient rallies. Similarly, semiconductors experienced a morning break in their higher highs and lows pattern.
Strategy for Semiconductor
A rangebound, choppy environment characterizes semiconductors currently, offering no significant opportunities. When a market signals ambiguity, consider stepping back, adjusting timeframes, or finding alternative trading avenues.
Biotechnology and Market Stagnation
Biotechnology stocks climbed to a previous low but were resisted, correlating with market conditions below their moving averages and year-to-date anchors. If engaging with biotech’s bounces, agility remains crucial, given the declining trend.
Financial Stocks: A Distributional View
Financial equities are undergoing profit-taking. My analysis suggests the possibility of a deeper pullback early next year. It’s crucial to watch how these defend the September low anchor, as a failure could lead to substantial declines.
Energy Sector Challenges
Energy stocks are searching for stability, with morning bounces failing quickly. Traders need to remain nimble. If you identified a morning low as a brief bounce point but saw declines, consider stops accordingly. Differentiating stronger past V-shaped turnarounds from current movements is key. The energy sector might be in a large stage three distribution phase, hinting at potential future declines. As declines hang over these stocks, particularly notable ones like Warren Buffett’s holdings, traders should be wary of deceptive pullbacks.
Bitcoin: Understanding the Crypto Cycle
Let’s shift to Bitcoin. This year, it doubled—a massive feat within a short time frame. However, the quest for liquidity and support tests resilience. Keep in mind, although Bitcoin has surged, prudent management remains essential, particularly when eying far-reaching price targets.
Enjoy your weekend, and happy trading!