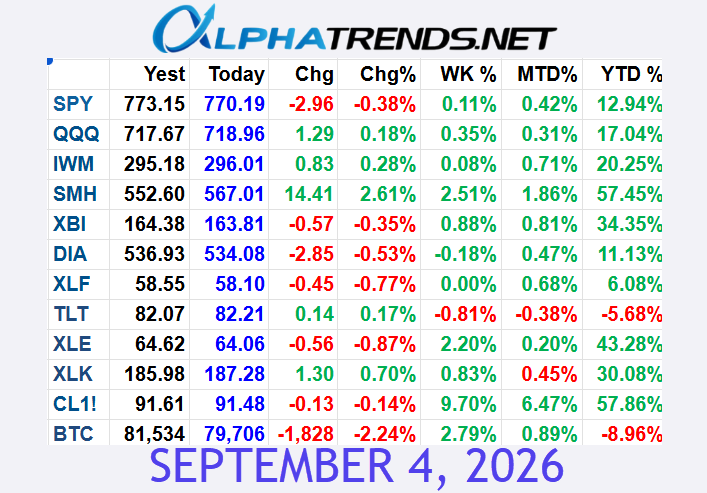
The markets gave us quite a rollercoaster ride. We’re just a mere 3-4% away from hitting all-time highs in the Nasdaq and the S&P 500, but this week wasn’t without its challenges. Several sectors took quite a beating, with the Russell 2000 dropping 4.5%, bonds down 2% leading to higher yields, and energy names losing a hefty 6%.
Chart Analysis
Let’s dive into the charts to make some sense of what happened. Using the trading view, it’s clear to see where we stand in relation to the five-day moving average. When the market is trading below this average and trending even lower, a red shading appears, indicating caution. This is particularly noticeable across the S&P 500, NASDAQ, semiconductors, and the Russell 2000. Although we witnessed a bounce in the S&P 500, it landed precisely on the anchor from its recent low—an area of significance I’ve discussed previously.
Understanding Market Levels
Levels of interest, such as the election anchor, continually guide our market behavior predictions. Despite touching these anchors, the anticipated bounce didn’t materialize, especially on shorter timeframes. On Twitter this week, I pointed out the lower highs in the S&P 500 and repeated support tests proceeded by the Fed announcement. Therefore, the drop below these levels wasn’t unexpected. What did surprise was the decline’s magnitude, although personally, I’m not one to buy the dip without evidence that buyers are regaining control.
Looking Forward
We saw some recovery this Friday as the S&P climbed back above significant anchors. However, we’re still below a declining five-day moving average. This doesn’t rule out a market turnaround, but the odds are not in our favor. Next week offers a chance for stabilization. Until we see more compelling recovery action, we’re in a day trading environment. I day trade myself, and amidst the market fluctuations, Bitcoin caught my attention.
Bitcoin slid down to a level I had anticipated, and being prepared with a bid allowed me to capitalize on this dip. I shared these moves publicly on Twitter, highlighting that Bitcoin—unlike stocks—often moves on emotional grounds more than fundamentals.
What’s Next for the Nasdaq?
The Nasdaq managed a rally to the month’s initial anchor levels, yet it succumbed and dipped below the week-to-date anchor by day’s end. Ideally, a shakeout below current lows followed by sideways action could signify a recovery. Yet, I’m skeptical we’ll experience that scenario soon. Adjusting market volatility and letting the five-day moving average stabilize might offer a clearer path forward.
The daily pattern remains intact with higher highs and lower lows, affirming that this pullback could just be another volatility blip in the longer-term trend.
Russell 2000 Struggles
Turning to the Russell 2000, it’s had a terrible run, failing multiple support levels spanning the August law to the election anchor. Even the 200-day moving average appears vulnerable. Potentially, we might see a new low, testing the anchor off the April low, but in this declining environment, all rally attempts face immense pressure.
Semiconductors and Beyond
Similarly, semiconductors are flirting with the danger zone, hovering around the 200-day moving average. Although some market defenders worked to lift it above this line, it remains confined within a larger range. Nvidia and other players might see short-term bounces, but lower highs and lows persist, pushing prudent traders to remain cautious.
Don’t be in a big hurry to buy the dip. If you do know that you’re buying it for a trade.
Biotech Breakdown
Biotechs have been an absolute mess since the election period, unable to stabilize, dragging down to a potential measured move target at 86. Even though it’s tempting to jump in, experience cautions against buying dip in downtrends marked by lower highs and lower lows. Patiently wait for a definitive shift in trend, substantiated by a higher high and a higher low alongside a leveling five-day moving average.
Bond Market Moves
Bonds had another rough week notwithstanding the Fed’s rate cuts. With rates unexpectedly rising despite these cuts, as evidenced by key rate changes from 3.65% to 4.50%, selling pressure dominated. The status quo for bond buyers shouldn’t be one of eagerness under downtrend conditions—it’s typically a warning sign.
Summing up the week’s action: stay cautious. The volatility witnessed reflects underlying market uncertainties, and as always, managing risk is paramount. Thanks for tuning in and enjoy your holiday. Remember, let’s see evidence before joining into market moves, and keep an eye on those support and resistance levels!
Happy trading!