

By Brian Shannon, CMT
Ulta Beauty (ULTA) is a consistently fast-growing beauty company with a stock chart that appears poised for 15-20% upside potential by the end of 2018.
Ulta operates 1,107 stores and plans to open approximately 100 new stores by the end of the 2018. The company sells more than 20,000 different products and represents over 500 brands in its stores and online.
This company has seen overall revenues increase each year since going public in 2007. In 2013, total revenues were $2.67 billion, and that number more than doubled to $5.88 billion by the end of 2017. You have probably seen their stores, but they also have a fast-growing internet presence. In 2013, online sales were $96 million, and for the last full year (2017), the online sales grew to $569 million, close to a 600% increase.
In the chart below, each bar represents one week of trading in shares of ULTA from the beginning of the third quarter of 2014 through July 23, 2018. The yellow highlighted area shows each of the quarterly earnings-per-share reports. The company been profitable every one of those quarters, and the lowest growth of earnings per share in that time was 22%.
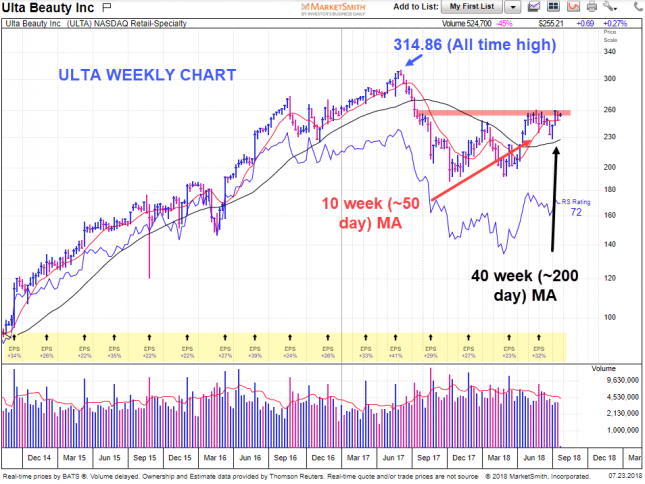
Source: MarketSmith
On the weekly chart, we can also see that ULTA is holding above the rising 50-day moving average (DMA) in red on the chart and the rising 200 DMA shown in black. Holding above these two averages indicates that the pullback, which began in the summer of 2017, has transitioned back to an uptrend. For this leg of the uptrend to continue higher, it needs to clear the recent band of resistance between $258 and $261.
CONTINUE READING ON YAHOO FINANCE Scroll down below the video.