

By Brian Shannon, CMT
VIEW THE VIDEO and LIST OF WHERE TO FIND AVWAP AT THE BOTTOM OF THE PAGE
Price has memory. That is a key concept in technical analysis.
One of the basic tenets of the study of price history is “support broken, tends to act as resistance.” The opposite is also a technical analysis maxim, “resistance broken, tends to act as support.” Have you ever considered why you see this play out on a chart so often?
It is simple, it is because of the “anchoring bias.” Briefly, the anchoring bias is the human tendency to rely heavily on the first piece of information encountered when making decisions and then use that initial piece of information to make future decisions.
Think of the price you may have personally paid for a stock. You tend to base your future decisions about that stock based on your purchase price. We calculate risk from that level and we measure our return based on that entry price. For better or worse, we are “anchored” to the price we paid.
Price charts are used in an attempt to understand the collective reasoning and psychology of the participants so we can objectively prepare our trading plan. In the case of traditional (horizontal) support being broken and then acting as subsequent resistance, the more participants who are “anchored” to a price level, the greater a move will become when there is a break of that price point. When price breaks a major level of support, the “trapped longs” will have a propensity to look to get out at “breakeven” the supply from these participants helps to form resistance.
In a trending market, the classic horizontal support and resistance levels are not always obvious. If we want to measure price memory from an “event” the Anchored Volume Weighted Average Price tool is the most effective means to accomplish this task.
First, let’s define an “event.” In the markets, I consider a significant event to be any date from which price movement began or reversed. A short list of such events could be: earnings dates, week to date, month to date, year to date, FDA announcements, Fed announcements or just simple swing highs and lows.
The daily chart of the S&P 500 (SPY) shows a few of these levels.
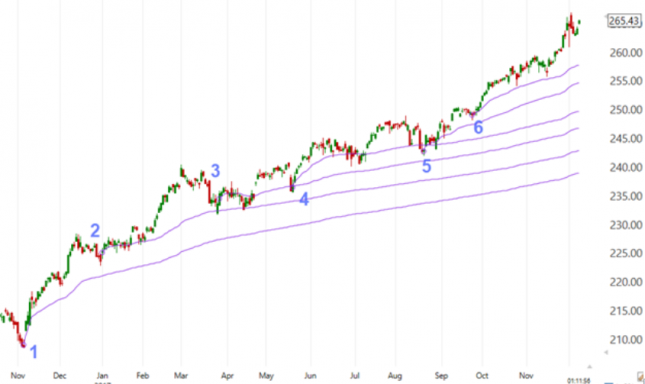
1- The AVWAP from the Election. If prices remain above the VWAP from the election, the average participant from that date is assumed to be in a winning position from that point. Notice that the longer the anchor point is on the chart, the less sensitive to current price action it will become.
2- The AVWAP from the beginning of 2017. Notice how buyers defended the average price for the year as prices pulled back in late March and mid-April.
3, 4, 5 & 6 – These VWAPS were anchored off of significant pullback lows, notice how buyers emerged to defend these levels on subsequent pullbacks.
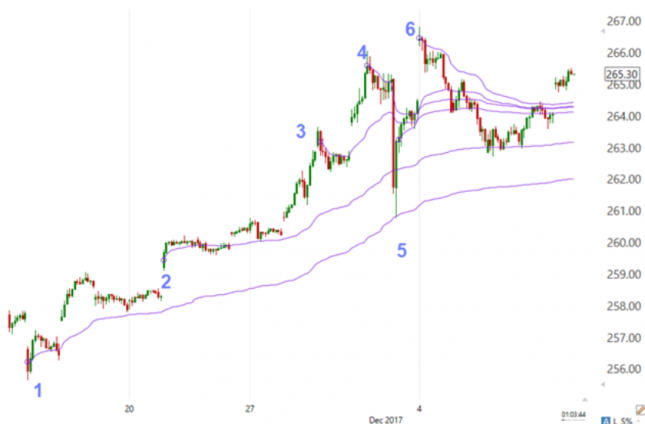
The AVWAP is not just useful on longer term timeframes, it can also reveal some key insights about market behavior on intermediate and shorter-term timeframes. The SPY chart below shows approximately one month of trading in the SPY.
1- After gapping lower, buyers took control of the SPY and the AVWAP from that swing low provided intraday support on a panic selloff at point 5.
2- As buyers became more aggressive on the gap higher, this AVWAP was briefly violated in early December, but then proved to be a good support level as prices stabilized near 263.
3- The AVWAP from this swing high briefly provided support near 264 before breaking down to the AVWAP on point 2.
3, 4, 5, 6 Notice how the AVWAPs from the swing highs (3, 4, 6) tied together with the AVWAP from the panic low at point 5 to act as resistance between 264 and 264.25. The gap above these AVWAPs put buyers back in control and now that cluster of AVWAPs will likely become support on pullbacks.
I do not ever expect to find the “perfect indicator” for trading and investing in stocks, however I do believe that the AVWAP can provide invaluable insights into the sentiment of the overall market or individual stock you are trading. The AVWAP is the perfect combination of: Price, Volume and Time. When this market trifecta is measured together it allows us to objectively identify the emerging sentiment from that point.
Because of its moving property, the AVWAP can be analyzed in ways like a traditional moving average. Some considerations when using this indicator include; direction and slope of the AVWAP, how far above or below price action is in relation to the AVWAP, etc.
A robust indicator such as AVWAP can be implemented into any trading analysis or strategy. Experiment with various anchor points in you targeted markets and stocks and you will immediately recognize its value. As a stand-alone study or when viewed with other oscillators and indicators, the AVWAP is likely to become one of your favorite analysis tools.
Use THIS LINK to receive a $25 discount on the same software used in Alphatrends videos where the AVWAP concepts are applied to real trading ideas everyday.
I am pleased to announce that TrendSpider also has the Alphatrends Anchored VWAP! Use “ALPHA20” for 20% off a subscription to TrendSpider.
Here is an example of one of their charts.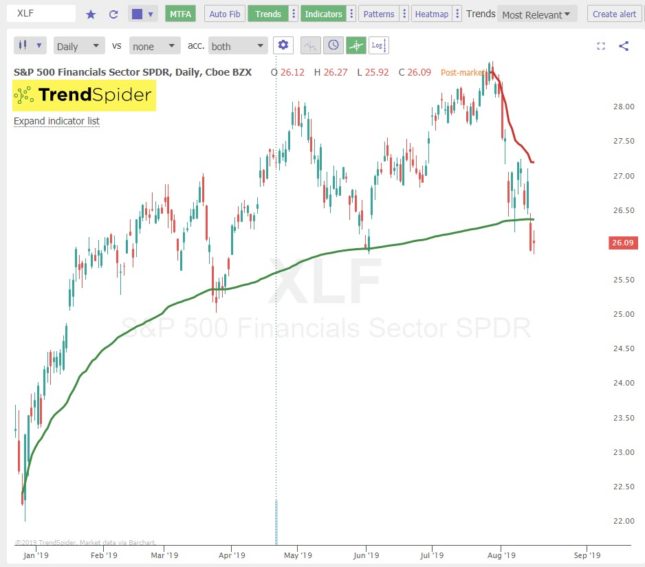
Trade-Ideas has also added the Alphatrends Anchored VWAP to their charts and they have several VWAP scans available too!
Here is the official Here is the official Alphatrends Anchored VWAP for Ninja Trader
Yahoo Finance has a Free AVWAP but you have to manually type in the date to anchor from
TradingView also has point and click AVWAP.
Optuma also has the Anchored VWAP
This is the best script for Anchored VWAP in Think or Swim
If you subscribe to a charting via links on this page, we may earn a commission. Our editorial content is not influenced by commissions