

Like many stocks I trade, I have no idea (or interest) in what $BGC does to justify themselves as a company.
I am a trader of stocks and this stock looks interesting as a swing trade candidate.
If I was an investor, I would look at that 2 year inverted head and shoulders pattern and think “wow, that looks like a good investment candidate if it passes my fundamental tests.” An investor would probably also be interested in the fact that the “neckline” of that inverted H& S pattern is now acting as support.
A really astute observer of PRICE ACTION would notice that the VWAP from the peak in 2013 (thats the purple line which I outlined with red arrows on the WEEKLY timeframe on the left) is where this “support” is found. The significance of this is..
After 4 years of losing ground, the average participant from the peak is now making money!! This represents A HUGE shift in the psychology of the supply/demand equation (which is what matters in stock trading and investing!)
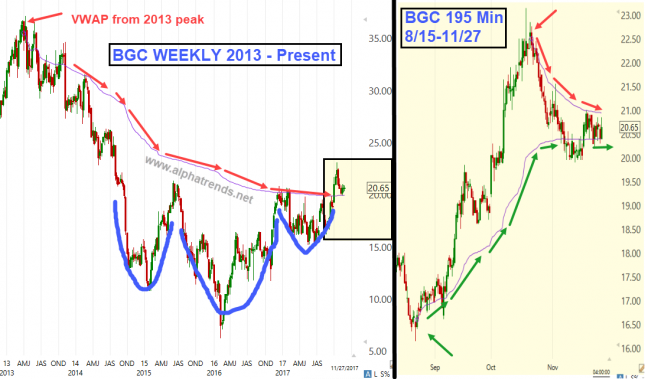
The chart on the right is a closer detail of the boxed in area on the left WEEKLY chart (do you see how the prices line up?) What the shorter timeframe reveals to us is that the average price since the pullback from the recent highs (near 23) is now at ~21.00.
This is meaningful because if BGC trades back above 21.00, the average participant from the HIGH is now making money!
Besides profit taking, why would you want to sell if the average participant from the last 4 years and the most recent price move is now making money? My plan is to buy above 2100 and then set a stop which is appropriate for MY TIMEFRAME. What is YOUR timeframe? Make each trade your own and have reasons for being involved.
I am happy if this makes sense to you. If it does not, perhaps you should look at one of the Alphatrends Courses or try our subscription service?