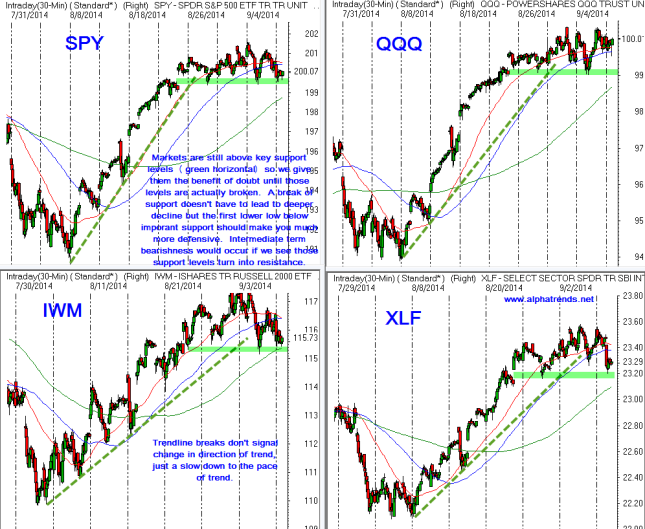
Markets are showing some signs of fatigue but they are still in solid uptrends on the longer term timeframes. The charts of SPY, QQQ, IWM and SMH are shown below on for the period of just over a month. Each candle represents 30 minutes of trading so there are 13 candles per day. The three moving averages on there are 5, 10 and 20 days. This timeframe does an excellent job of revealing to us important levels of support and resistance for the intermediate term.
• Primary trends remain higher
• Intermediate term trends showing fatigue
• Current “correction” is through time rather than price pullback
• As long as key support levels hold we remain cautiously optimistic
• If key support levels fail and then turn into resistance we will be looking for deeper intermediate term correction
• Short sales will still be difficult with primary trends solidly higher
• Don’t throw your stocks away just because a support level for the market fails
• Stops should be managed on each individual trade
• If you are nervous reduce position size
• It is better to be on the sidelines in cash than it is to be fully invested wishing you took some risk off


