Below is chapter 15 of MY BOOK about the dynamics of a short squeeze and what to look for in a developing squeeze. Read this before you look at the chart of PLUG below.
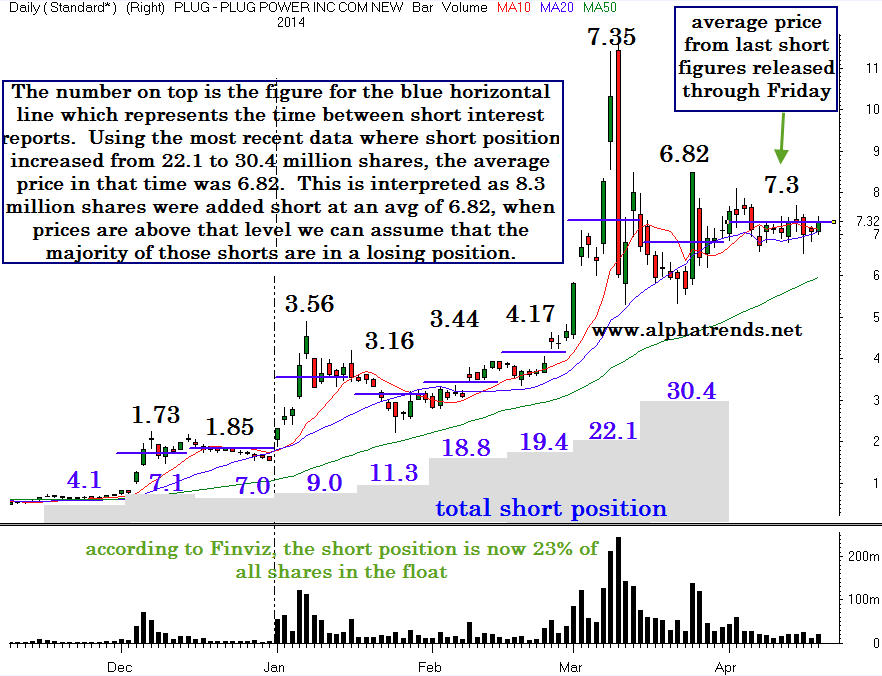
The chart below is of PLUG, I have drawn in the total short position below the price, the labels show the actual number of shorts outstanding at the end of each report. This data was taken from the short interest below the chart. The short blue horizontal lines on the chart are the VWAP during that time period, I have labeled the actual number just above the price candles and on the table below the chart. With a bullish chart and a lot of shorts apparently on the wrong side, PLUG looks like it could continue significantly higher. Risk management is always job #1! If the shorts are correct and the stock declines, know where your stop is before it becomes a “long squeeze!”