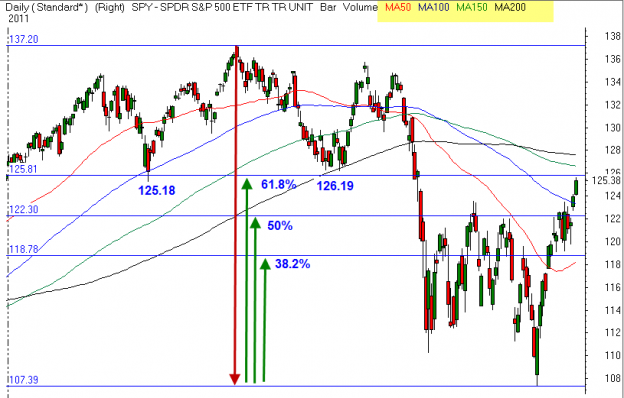
After taking out the resistance at 123.50, the $SPY now appears headed for a 125.80- 126.65. This range encompasses a 61.8% retracement of the year high to year low, the prior support near 126.19 and the 150 day moving average (green) at 126.65. The intermediate term trend remains higher.
What's In It For Me?
Signup To Get Free Friday Swing Trade Stock Market Analysis and 2 Free Swing Trading Guides
Get the Friday Stock Market Analysis Video and the Alphatrend’s Swing Trading Guide and the 4 Stages Of Stock Cycles Chart.