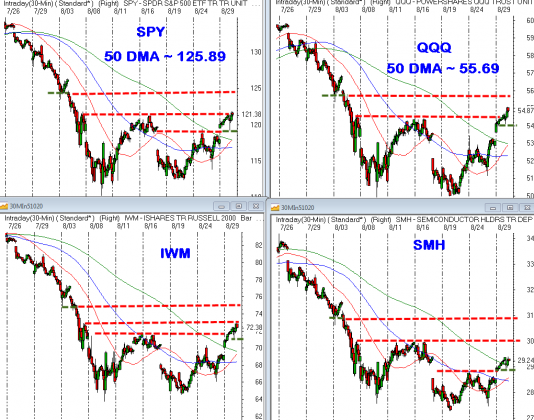
It is difficult to appreciate the volatility of the markets today by looking at these 30 minute charts. Generally, the markets are behaving well. We saw an early pullback which is now the basis of a higher low. Today’s lows found buyers near key levels (discussed in yesterday’s video) which is where “buyers were supposed to be found”.
As long as levels of support (green dotted lines) hold the intermediate term trend should be viewed with cautious optimism, but don’t lose sight of the larger downtrend with declining 50 day moving averages. The red horizontal lined indicate potential resistance levels if the market continues to move higher.


