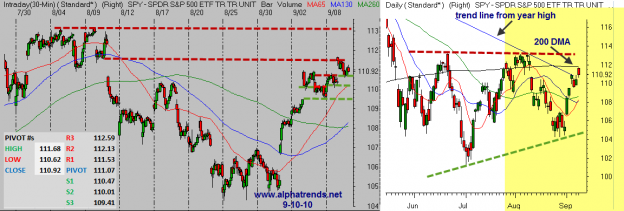
The gray background chart (which shows 30 minute candles) is a closer look at the yellow shaded daily chart on the right.
The SPY has been holding up well as it makes a series of higher highs and higher lows above the rising 5 day MA (red on left chart). On the daily timeframe (chart on right) the market has broken the downtrend line which connects the April and August highs. The market is also battling with the 200 DMA which is now found at ~111.79. Unless support levels break (first at 110.60, followed by 110.10 and 109.55) it appears the market wants to continue higher up towards the upper boundary of the last3 months near 113. At this point I am cautiously optimistic but that stance will change quickly if support levels are broken.


