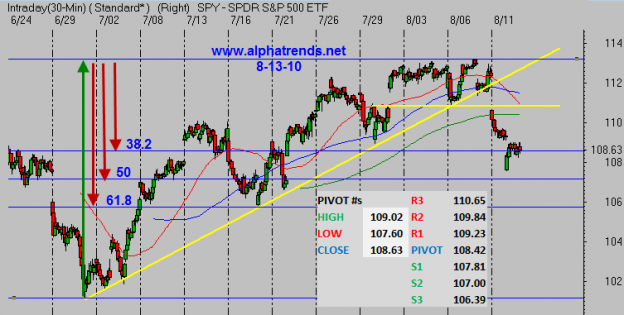
The uptrend from late June has been decimated in two short days. Ok, that may be a little dramatic, but the damage has been quick and painful for those who were slow to react. The gap on Wednesday violated the uptrend line and the 111-113 range the market been was broken. Additionally, the prior support (also the location of the 50 DMA) ~109 failed to hold with a negative reaction to jobless claims on Thursday. A look at the SMH and XLF daily charts reveals a more severe selloff down to the bottom of the prior ranges, a similar move in the SPY would see the market back down towards 105…
Short term, the market is down to the 38.2% retracement of the June low to the high made last week. Fibonacci levels are good reference points (like moving averages) but by themselves are not a reason to buy or sell. Technical levels are good for telling us where battles for control may occur after a move has been made, they are levels which should be studied on shorter timeframes for an indication that the trend may be tiring. Right now, there is a clear pattern of lower highs and lower lows below the declining 5 day MA (red MA on the chart below) and that tells me that rallies are not to be trusted for anything more than a daytrade.
The weekly SPY chart had a chance to break the pattern of lower highs and lower lows and the bulls came close but failed to deliver which leaves the longer term trend pointing lower. If you are an investor you should be very concerned.
Join me live at 4PM Eastern on Friday for a more in depth look at the major indicies on http://www.stocktwits.tv


