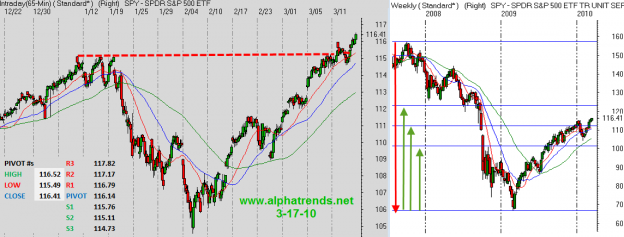
The weekly chart on the right shows a clear pattern of higher highs and higher lows and now the 61.8% retracement of the 2007 high to the 2009 low is looking like a more realistic target over the next few months. Short term support levels should be found near 115.80, 115.50 and 114.60. It is easy to say the market is “extended” but until there are signs of weakness there is no reason to attempt the short side.


