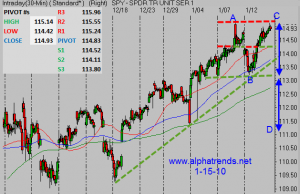
Please don’t call it a double top yet… In order for a double top to form, the market has to reach resistance in the approximate level as a prior peak, which it has done. Next, the trendline should be broken (not yet and now near 114) and most importantly for a true double top it needs to take out the low which defines the “M” look which the pattern forms. On the SPY point “A” is first resistance, point “B” is found near 113.20 and point “C” is the high made on Thursday near 115. If a double top forms it will be identified on a break below 113.20. The significance of a double top is that it is supposed to project a bearish target equal to the height of the pattern (115-113.20= 1.80 points) subtracted from the breakdown level of 113.20 for a target at point “D” of 111.40 (113.20-1.80).
I point this out because “double tops” are amongst the most misdiagnosed technical patterns in an uptrend. Perhaps time will reveal this to be a true double top, but for now 115 is simply a near term level of resistance a break above that level clears the way for higher highs. If market weakness prevails, the more significant support will be found near the rising 5 day MA and prior support/resistance level of 114.30. If that support fails to hold the next downward of significance will be found near the uptrend line and then point B at 113.20
click chart to enlarge


