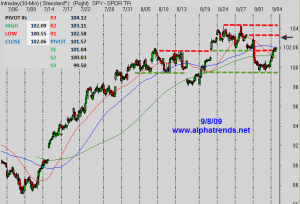
The black arrow on the chart indicates where the SPY is currently trading ~102.90 which is just below the area where the market gapped lower (on 8/31) and had subsequent resistance at approximately 103.25. Above the 103.25 level the next potential area of resistance is the recent highs near 104 and then the 10/14/08 high of 105.53 The best support on any pullback will be 102. The persistance of the buyers remains impressive and the short side continues to make sense for quick intraday trades.


