The chart below is a 2 minute chart (each candle represents 2 minutes of trading) in the Financial Sector Spyders (XLF) from Friday. The numbers on the chart line up with my comments (left of the chart) on twitter about the XLF. Each comment is timestamped, the 2 hour difference is my local time versus Eastern time shown on the chart. My original unedited comments are shown along with further, after the fact, explanation in red. I was actually trading the FAS (triple leveraged long) but because there are still many traders and investors who do not understand the unique risks to the leveraged products I focused my comments on the non-leveraged ETF.
See my video discussion with Tim Bourquin about LEVERAGED ETFs (you can fast forward the commercial). I accidentally referred to the QID as double long QQQQ in the video, that is incorrect. QID is double short and the double long symbol is QLD.
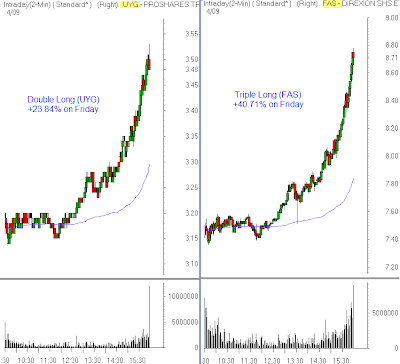
The next two charts are the same timeframe (2 minute candles from Friday’s trading) as the XLF shown above. The chart on the left shows the double long financial ETF (UYG) while the one on the right shows the triple long financial ETF (FAS).

If you understand the risks and can be disciplined in executing your trades, the leveraged funds may be something worth considering for your own trading. As good as the long side funds acted on Friday, take a look at the double short (SKF) and triple short (FAZ) funds performed on Friday, these things move!


