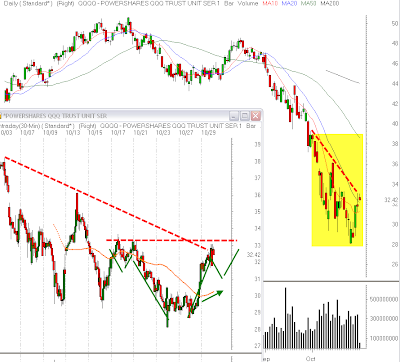
The chart below shows the Daily and 30 minute timeframes for the Qs. The area shaded in yellow is magnified with 30 minute data on the inset chart. This rally is still within the confines of a bear market so all long plays should be smaller size and have strict risk management. One potential scenario is a continued pullback which would meet up with the rising 5 DMA (maybe near 31.00?). A pullback like this would also build a right shoulder for a crudely formed inverted H&S pattern with the neckline near 33.35. A break of that neckline would lead to a conservative upside target near 37 which is near the high from Oct 14 and where the declining 50 DMA could be met. For now, it appears we need to consolidate further before such a scenario could unfold but it is something to keep in the back of your mind. Let price action dictate, it remains a volatile and dangerous market.


