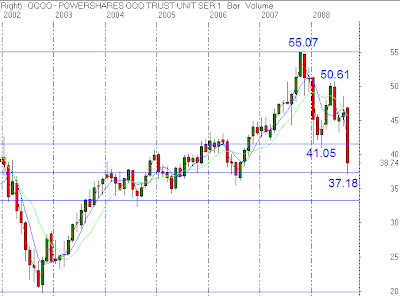
In yesterday’s video I mentioned the confluence of the 50% retracement of the 2002 low to the 2007 high and the measured move.
The measured move target is calculated by taking the high of 55.07 and subtracting from it the low at 41.05 which is 14.02 points or 25.45%. From peak to trough, that is the range of the first drive lower on the weekly timeframe below.
Using the 50.61 recovery high and subtracting 14.02 points would yield a downside target of 36.59. The actual low (so far) has been 37.18. If you look at it from a percentage view though, this drive lower has actually pulled the market down deeper than the first selloff. If we subtract 37.18 from 50.61 we can see that this leg has declined 13.43 points, but divide that into 37.18 and the market dropped 26.53% from peak to trough.
When levels like this are reached it makes sense to look for reasons to buy, but right now the only trends which justify any purchases for most stocks is the one minute timeframe. This bounce should be viewed as just that, a bounce in a downtrend. Time will tell us what the actual lows will be but risks remain high and my opinion is that daytrading is the best way to compensate for those risks.


