click chart to enlarge

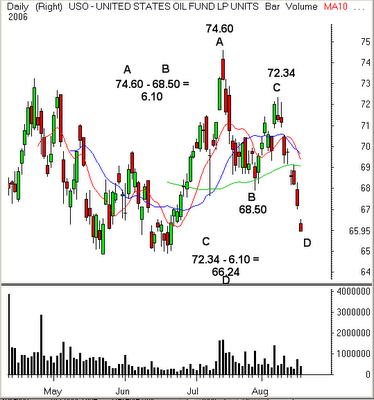
The recent selloff in oil looks to be approaching a potential level where shorts may want to consider covering their positions. The United States Oil Fund Units (USO) is an oil ETF and the chart shows the symmetry between the recent high near 72.34 to current lows and the selloff in July which brought the market from 74.60 to 68.50. The “measured move” represents a tendency of markets to make near equal moves and can be used to approximate price objectives. For the USO, now that the measured move target has been attained it suggests it is time for shorts to tighten their stops.


