The video I prepared did not work on my laptop so I have rewritten an article on the psychology of a turnaround with updated charts. Click charts to enlarge.
QQQQ Weekly QQQQ Daily
 QQQQ 60 Minute
 QQQQ 2 minute
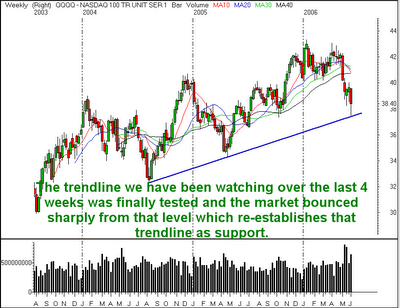
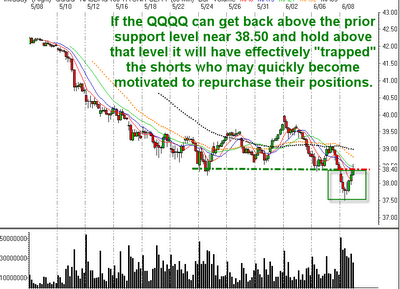
Technical analysis is not perfect. It is not enough to be able to identify head and shoulders, flags, triangles, shooting stars, dojis, etc. and be able to make money on a consistent basis. There is a lot of technical lingo that many traders take as gospel, “support broken, becomes resistance” is one such example. True, support broken often does become resistance and I often point it out on this blog when I see it. But many times the market will turn around and run back up through that resistance level, leaving traders without a position, or worse, short a market which is now surging higher. That is why our analysis cannot depend on mere recognition of patterns and formations. In order to truly succeed in mastering technical trading, we need to understand the motivations of the participants, we need to understand psychology. Let’s look at the current chart of the Nasdaq 100 (QQQQ). Wednesday afternoon’s breakdown through the support at 38.50 seemingly put the sellers in further control of the trend and that is why it made sense to favor the short side. But late day strength put the short term trend in favor of the bulls (see the 2 minute chart), so we must ask what if the market is able to surge back above the level we now see as resistance at 38.50? (see hourly chart) Yesterdays late day strength showed that there were buyers near the longer term trendline from the weekly chart.
As traders we always have to be prepared for the unexpected which is why you should always have a list of potential long and short candidates, be prepared for anything the market gives you each day. Remember, the market loves to fool the majority of participants, so you must think different than the majority. Let’s try to understand the current psychology the charts are reflecting in the QQQQs.
You’ve likely heard that during sell offs stock moves from “weak hands to strong hands” What that means is the sell offs force those with little conviction in what stocks they hold to sell quickly, many short term traders like myself fall into this category. I am a trader, I do not want to stick around when the selling starts; I would rather protect my equity and look for better opportunities where the trend is in my favor. The “strong hands” who buy on this weakness are people who have done fundamental research on the company and are happy to purchase more shares at a lower price. Which camp you fall into is based on your own personal psychology, but we need to understand the motivations of all participants to succeed on a consistent basis. What about the “evil short sellers”? When prices break down, they realize they are in a position to induce further fear by offering stock out; sometimes just showing big size on the offer is enough to force further selling in weak stocks. Short term traders may also sell short hoping to capitalize on further weakness.
So how does this relate to the current market? Let’s think about what would happen if the market were to climb back above 38.50 and hold there for at least a few hours. Yesterday afternoon we saw big volume buying after the weekly uptrend line was tested, this volume can only come from institutions. By buying large quantities of stock and pushing prices rapidly higher, the short term short sellers would quickly repurchases their shorts, this adds further demand. The longer term shorts might move to the side and not offer out stock for fear of being run down by the momentum, this removes supply. As the market runs up past 38.50, sidelines cash from the “weak holders” who sold on earlier weakness might re-enter the market (more demand). The problem is, who is going to meet all this demand by offering out supply? The “strong holders” are just that, strong holders, they are not likely to be willing to sell their stock for small gains, they will demand (and be able to get) higher prices at a point in the future (likely after upgrades and positive news comes). The combination of a removal of supply from weak holders and overconfident short sellers and the new and unforeseen source of strong demand could combine to not only push the market back up above the level now perceived as resistance, but it could spark a strong rally as shorts scramble to cover and fresh money enters from the sidelines. This phenomenon is known as a “bear trap” which essentially means the bearish sellers are trapped in unprofitable positions which they must cover to limit losses. Understanding this psychology is also the basis of the phrase “from false moves come fast moves” meaning a breakdown which fails to hold becomes the basis of a stronger move in the opposite direction.
Of course, none of this has happened and it may not, but if the Qs can make it back above 38.50—38.60 and hold, a bigger rally could unfold. Remember, though, the longer term trend is still lower. Any rally we see from here is not likely to lead to a complete turnaround. Stocks and the market need to correct not only by price, but they also need time to correct from a severe sell off like we have seen recently. It is my belief that the market is setting up for a period of lower volatility consolidation over the next couple of weeks, but I also realize the market doesn’t care what I think so I will keep my eyes open for opportunities on the long and short side and trade what the market gives me.


