

This week brings the real beginning to earnings season with over 300 companies scheduled to release their latest quarterly results. Be certain to know when the your stocks are due to report so you do not get blindsided.
As for the markets, it is a real mixed picture, first we will look at a couple of things to worry about.
OIL
 border=”0″ / I showed this chart last week and now that the price of oil has remained above the prior resistance level I thought it was worth another look. This is the Light Crude continuous contract (courtesy of www.stockcharts.com) and it shows the closing price at 70.82, which is an all time closing high and just 3 pennies off the intraday high of 70.85 recorded back in August. The bullish cup and handle formation traced out on the chart indicates potential upside in crude to about $84, if this market is on its way towards that level it will definitely not be good for equities.
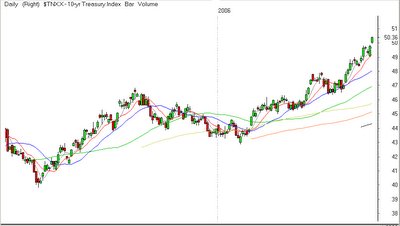
10 Year Yield
 border=”0″ />
This is the daily chart of the 10 year treasury yield. It closed on Thursday at 5.036%, the first close over 5% since June of 2002 and this trend looks unstoppable right now. In fact if you took the reference to price and the label off the chart, it looks more like a chart of Google late last year than the lowly 10 year yield.
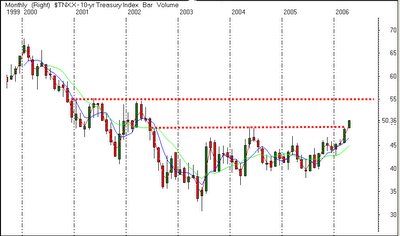
Here’s another look at the 10 year yield, this time using monthly candles. Any amateur technician can see that this chart broke out and the next level of potential resistance looks like it will be found near 5.40-5.50%. Getting to that level would definitely not be good for equities.
Now let’s look at the SPY and the QQQQ.

This daily chart of the S&P 500 (SPY) shows a break of the uptrend line from the October lows. Whether you want to blame this break on oil or interest rates is up to you, but the up trend has been broken, that is the bad news. The good news is that breaking a trendline does not automatically mean the market will reverse (although it sometimes does). What it does mean is that the market is due for a period of consolidation at the least and a reversal at the worst, either way the prudent course of action is to lower your risk tolerance because mistakes can get exaggerated in this environment. It is hard to see on this chart, but the market did close below the rising 50 day moving average (now at 128.91 vs. a close of 128.71) and that is another reason to be cautious. If the market is going to consolidate rather than reverse, the levels of support that should be watched closely are 128.25 (this week’s low) and the early March low of 127.18, breaking below that level could lead to a more serious decline.
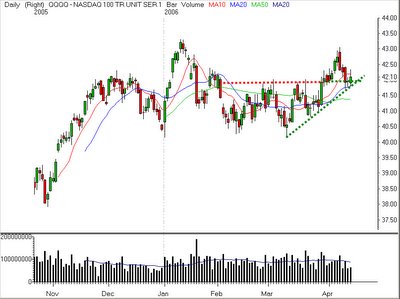
Here we are looking at the daily chart of the Nasdaq 100 Trust (QQQQ) which does not look nearly as ominous as the SPY. The horizontal line of prior resistance near 42 looks to be holding as support for the market and this level is further strengthened by the short term uptrend line from the mid-March lows and it is also the level of the rising 20 day moving average. These factors together make the QQQQ at a very important level going into next week, a failure here could lead to a quick and severe selloff as trapped longs liquidate and the bears press their bets. If earnings are good and oil does not rally further and weakness in bonds does not persist, the market could be setting up for a nice rally. That’s not too much to ask, is it?
The bottom line here is the market is in a tricky spot with a lot of different potential catalysts in the coming week. I do not try to make market calls, instead I observe and try to stay one step ahead of others by being aware of the possible scenarios. I am convinced that regardless of short term market direction there will be some strong trade setups where there is a favorable risk reward and if you check back later this weekend I will post some individual stock charts which are poised for trend continuation and we can pick up some alpha.
All of the other charts are courtesy of www.realtick.com