

OK, I got shaken out of the majority of my position in CPST today, but as a trader when I see profits disappear I react as if someone was taking food off my table, quick and without mercy. It reminds me of a saying “it’s better to be on the sidelines wishing you were in than it is to be in wishing you were out”. I’m not sure who gets credit for that one but it certainly rings true, there will always other opportunities in the markets for those who protect their capital. This does not mean I have given up on CPST or my thoughts that there is a short squeeze coming, I just do not think the time is right, I think the stock needs to heal a little before it can continue higher again. I still believe in the company, it is the stock action that has to prove itself to me.
Different subject….. Oil
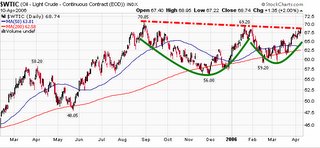
Let’s look at a daily chart (courtesy of http://www.stockcharts.com/) that goes back a little over one year.
Oil is clearly in a strong uptrend. There was talk of a double top earlier in the year, which amused me because it would not have been confirmed as a double top until after it broke below the December low, which it did not do. Just because a market finds resistance in the same place twice does not make it a double top… but this is not a double top lesson. Now you could say that oil seems to be tracing out a bullish cup and handle pattern, or is it an ascending triangle? Forget the titles, the fact is oil is bullish; it is getting more bullish as the stock approaches a breakout past that 70 level. What is a cup and handle? It is a pattern where buyers become more aggressive with a stock as it approaches a resistance level. Like most cup and handle patterns, the oil chart shows buyers becoming more bullish both through price action and also time. Price- The higher lows (56.00 and 59.20) show that buyers aren’t willing to wait for a pullback as deep before they make their purchases. Time- the high at 70.85 was followed by a lower high at 69.20 approximately five months later. Now those highs are being challenged just two and one half months later, buyers are getting more aggressive timewise. What does this mean? It means that it is very likely that oil is getting ready to breakout and move out to new highs, A potential price target could be the height of the pattern (Resistance at approximately 70 minus the low at 56, 14 points) added to the breakout point (70) which yields an upward target of 84. Personally I hope it doesn’t happen (who likes paying north of $3.00/ gallon for gas?) but the market doesn’t care what I want. If there is a breakout it will benefit oil companies, alternative energy and maybe even speculative plays like ZP (shown on Monday). Look back here for some ideas in this group over the next few days.