End-of-Week Market Analysis (Feb 20, 2026) – Brian Shannon’s Technical Recap
This end-of-week market analysis breaks down what mattered most across stocks, sectors, bonds, and crypto using a clean technical framework – moving averages, ranges, anchored VWAP, and risk management. If you missed the video, this recap gives you the key takeaways and a practical checklist to carry into next week. ⚓
Market Overview
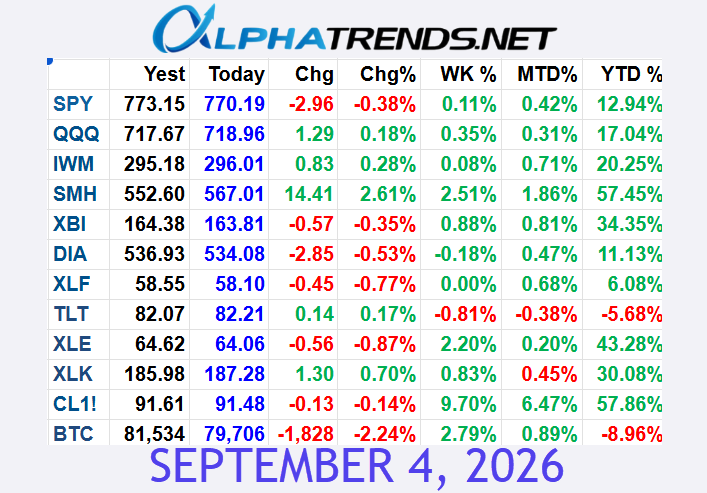
Markets were broadly positive on the week, while bonds slipped slightly and crypto remained weak. The bigger message: price is still working through a corrective phase, so the job is to stay objective and manage risk instead of forcing trades.
- Stocks – positive week, but still inside broader ranges.
- Bonds – gave back some gains after a prior strong move.
- Crypto – structure remains neutral-to-bearish with sellers in control.
- Focus – moving averages, ranges, anchored VWAP, and disciplined trade management.
Major Index Takeaways
S&P 500
The S&P 500 had a constructive week and moved back above the 5-day moving average, but it remains inside a larger multi-month corrective range defined by key moving averages and anchored levels.
- Strength improved short-term – reclaimed the 5-day moving average.
- Bigger picture remains range-bound – still part of a ~2.5-month correction.
- Context matters – avoid treating a good week as a full trend change without follow-through.
NASDAQ
The NASDAQ is pressing just below a key confluence of resistance (declining 20-day, 50-day, and an anchored level). A clean break above that zone is needed to shift the short-term picture toward neutral.
- Resistance cluster overhead – 20-day, 50-day, and anchored reference points.
- A decisive break matters – it would reduce the “sell the rally” pressure.
- Until then – expect chop and failed pushes to remain possible.
Russell 2000
The Russell 2000 remained constructive, holding above an anchor and a rising 50-day moving average. The 20-day had been declining but is expected to flatten, while the weekly trend remains higher.
- Structure constructive – holding above key support references.
- Watch the 20-day – flattening often precedes a pause or a directional move.
- Use it as a tell – small caps can help confirm broader risk-on behavior.
Sectors and Asset Classes in Focus
Biotech
Biotech is stuck in a messy range, forming an apex (lower highs and higher lows). Rather than chasing the first breakout, the preference is to see a rally, then a pullback that sets a higher low before entry.
- Apex behavior – compression can lead to a strong move, but timing matters.
- Preferred approach – wait for higher-low confirmation after a rally.
- Avoid “first break” risk – early breakouts in ranges often fail.
Financials
Financials pulled back into an expected area and are stabilizing, but remain lower priority for short-term trades. A potential multi-week head-and-shoulders formation may be developing, but it is not actionable yet.
- Stabilizing, not leading – keep it on watch, not on the front burner.
- Pattern notes – interesting structure, but no edge without confirmation.
Energy (XLE) and Oil
Energy showed mixed action. If already long, consider staggered stop placement. Oil had a strong week, supported in part by rising Middle East tensions.
- XLE – mixed signals; manage risk with structured stops.
- Oil – strong week; headline sensitivity can increase volatility.
Bonds
Bonds gave back some ground after a prior strong move, which can be normal profit-taking following short-term extension.
- Expect two-way action – don’t overreact to normal pullbacks after strength.
Crypto and Bitcoin
Bitcoin remains neutral-to-bearish with declining 20-, 50-, and 200-day moving averages. The takeaway was to stay sidelined until the moving averages and structure improve.
- Trend alignment is weak – multiple declining moving averages.
- Sellers remain in control – patience is a position.
- Wait for improvement – cleaner structure creates better risk control.
Selected Large Caps Mentioned
- Apple (AAPL) – stabilizing after a sell-off; 5-day flattening but 50-day declining, so no clear long setup.
- AMD – some buyers appearing, but 20-day and 50-day still declining; avoid until trends improve.
- Amazon (AMZN) – bouncing near prior support and an anchored VWAP; risk/reward not compelling at current location.
Key Concepts and Technical Rules Used in This Recap
Moving Averages (the “state of trend”)
- 5-day MA – short-term momentum; flattening can precede a pause or versal.
- 20-day MA – short-term trend gauge; a declining slope often signals active sellers.
- 50-day MA – medium-term trend; rising slope supports bullish structure.
- 200-day MA – long-term trend reference and major support/resistance level.
Anchored VWAP and Anchored Moving Averages (the “crowd reference”)
- Anchor to meaningful highs/lows – all-time highs, major pivots, sharp flushes.
- Monthly anchored VWAP can define supply/resistance zones – especially in choppy markets.
- Anchors help clarify who controls the tape from a specific point – not from your entry.
Ranges and Structure (how price is behaving)
- Higher highs and higher lows – constructive uptrend structure.
- Lower highs and lower lows – downtrend structure.
- Mid-range trading often creates chop – wait for cleaner location near support/resistance.
- Apex consolidations can resolve with force – but confirmation matters more than prediction.
Risk and Trade Management Notes
When markets are range-bound, the edge often comes from execution and risk management. The video emphasized not chasing extended moves and using structure-based stops and staggered exits.
- Avoid buying into extended breakouts – look for retests and higher-low setups.
- Use staggered profit-taking and stops:
- Take one-third off on the first lower low or a 5-day MA break.
- Take another third on a subsequent short-term failure.
- Hold the last third until a higher low forms near a rising 20-day MA, then tighten the stop.
- Place stops near recent higher lows – avoid arbitrary dollar-based stops.
- Check risk/reward before entry – if you’re risking far more than the potential gain, pass.
Action Items for Next Week
- Track earnings dates for stocks you follow – avoid surprises you didn’t plan for.
- Watch the Russell 2000 and major indices – look for the 20-day MA to flatten and support trend continuation.
- Avoid chasing breakout extensions – wait for retests and higher-low confirmation.
- Manage open positions with moving-average-based stops and staged exits.
- Stay sidelined in Bitcoin and weaker large caps until moving averages improve.
- Monitor biotech and MAG for a decisive move out of the current range/apex.
- For XLE – observe price behavior around the 10-day and 20-day MAs to adjust stops.
- Note key tests of monthly anchored VWAP levels – especially near prior resistance zones.
Did you know?
When multiple moving averages and an anchored level stack in the same area, that “confluence zone” often becomes a decision point – either price breaks through with momentum, or it rejects and reinforces the range.
Important note
This recap is for educational purposes and focuses on process: trend context, location, and risk control. In range conditions, patience and discipline often outperform prediction.
Want more market structure breakdowns?
If you want daily structure-focused analysis from Brian Shannon, you can explore Alphatrends resources here:
- Follow on X (subscriber content available): Alphatrends X Subscription
- Alphatrends Premium Membership details: See what’s included