
A common question I receive is, how do you display a 5 day moving average on a 10 (or 30) minute timeframe? SEE CHARTS BELOW
When looking at moving averages you have to consider which timeframe you are looking at. If you have a chart with 10 minute candles, overlaying a moving average with the period being set to “five” does not give you a five DAY moving average, it gives you the average price for the last five – 10 minute periods, or the average price the stock traded at for the last 50 minutes!
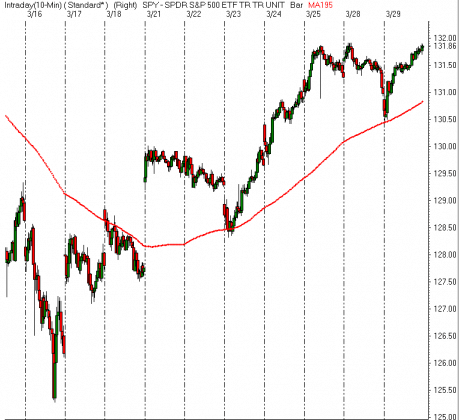
If you want to see a five DAY moving average on a chart with 10 minute candles, you have to consider how many 10 minute periods of trading there are in the trading day. The US equities markets are open from 9:30- 4:00 each day, which is 6.5 hours per trading day. In each hour of trading, there are 6-10 minute periods, so during the regular session for equities, the market is open for 390 minutes or 39-10 minute periods per day. If we are to get a five day moving average, we would take the 39-10 minute periods the market is open each day and then multiply that by five days. 39 x 5 = 195. So a 5 DAY moving average is represented by a 195 PERIOD moving average when looking at a 10 minute timeframe.
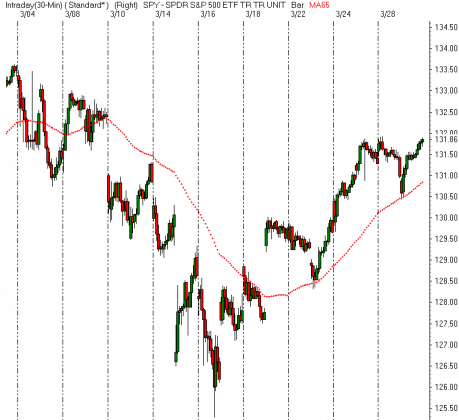
If you wanted to see the 5 day moving average on a chart with 3o minute candles, you would do the same type of calculation. There are 13- 30 minute periods during a day of traiding and over 5 days, there would be (13×5) 65- 30 minute periods. The 5 DAY moving average is represented on a 30 minute timeframe by a 65 PERIOD moving average.
The same type of calculation would be applied to other timeframes. If you wanted to see a 10 DAY moving average on these timeframes, you would double the number of periods to look at. On a 30 mintue timefremae, a 10 DAY moving average would be reperesented by 39- 30 minute periods.
What about a 5 day moving average on a 65 or a 15 minute timeframe? Seriously? Don’t be so lazy, you can see how the math works, sit down and figure it out!! (-:
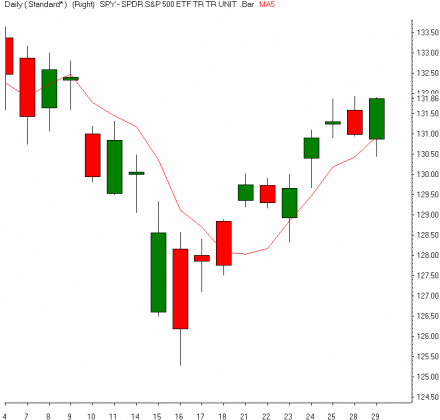
Below are charts of three different timeframes, each with a 5 DAY moving average.
The first chart is with daily candles and a 5 period (day) moving average.
When we change our chart to intraday timeframes like the 30 minute period below, the 5 DAY moving average is represented with 65 periods.
When we take a closer with 10 minute periods, we change the moving average to 195 periods to display the 5 DAY moving average.
 Here are the timeframes and number of periods to use in your moving average to replicate a 5 day moving average.
195 minutes = 10 period
130 minutes = 15 period
78 minutes = 25 period
65 minutes = 30 periods
39 minutes = 50 period
30 minutes = 65 period
26 minutes = 75 period
15 minutes = 130 period
13 minutes = 150 period
10 minutes = 195 period
6 minutes = 325 period
5 minutes = 390 period


