
The site www.viwes.com is no longer maintained. All of the short interest information I currently use in my analysis is taken from www.nasdaq.com (see link on right).
PROFITING FROM THE “SHORT SQUEEZE”
By Brian Shannon
Three of the key factors that influence people’s decisions when trading stock are fundamental analysis, technical analysis and the psychological aspect. Fundamental analysis is mainly concerned with why a stock may move; it measures sales figures, PE ratios, cash flow, dividends, etc. Short-term traders may find the fundamental information interesting, but on a stand-alone basis, trading on fundamental analysis rarely equates to profitable trades. In fact, following fundamental analysis is often an obstacle when trading because traders tend to form an opinion of what the stock “should do” and many times that opinion gets in the way of objectively analyzing what the stock actually does. Think of how many times have you may have bought a “good company” but it turned out to be a bad stock. Technical analysis, on the other hand, attempts to determine when a stock may move and how long that move may last. I have never met anyone who has consistently made money trading that does not utilize some form of technical analysis. Technical analysis allows the trader to objectively look at price action to determine what is a good or bad trade, without any understanding of what the company may do or what the fundamentals may be.
The final, and probably hardest factor to measure, is psychology. Understanding the psychology of stock movements is often measured through technical indicators and attempts to answer the question who? Who would be a buyer and who would be a seller under certain circumstances. Big money can be made in a stocks movement is when there is a favorable combination of the three factors listed above to uncover profitable upside opportunities.
In this article, we will study a specific technical indicator, short interest, in an attempt to uncover situations where a “short squeeze” may develop in a stock. We will then review a stock that has the characteristics of what may offer good upside potential based on these three factors.
Short selling is a strategy that attempts to capitalize on a decline in share value by selling stock at a high level and later repurchasing the security at a lower price. The short seller benefits by selling high and buying lower. It should be noted now that once a stock has been sold short, those sellers represent future demand because they must buy the stock back at some future date. The appeal of selling short is easy to understand, as we’ve seen in this they take for the stock to make a comparable move higher in an uptrending market. Of course, as with any strategy that is a straight directional bet, there are risks involved. The biggest risk to a short seller is that instead of share price dropping, the stock price rises. We will see later that a rising share price in a stock that is heavily shorted can often lead to dramatic upward movement as losses mount in the accounts of those who are short and they attempt to minimize their losses by buying the stock back. The motivation to buy back the stock by the short seller is often the fear of unlimited losses. When you buy a stock at $20/ share, the most you can lose is your entire investment, $20.00/ share. When you sell a stock short at $20, the potential for losses, in theory, is unlimited. The stock may rise to 40, which would result in a 100% loss of capital, but what prevents that stock from rising to 50, 60, or even 100? It is the fear of such an advance that can make for explosive upside in a heavily shorted stock. The phenomenon of a rapidly rising stock with a large short interest is known as a “short squeeze,” and we will now explore the dynamics of how a short squeeze develops.
Before we continue, let us first cover some terminology. Short Interest is defined as the total number of shares of a stock that have been sold short and not yet covered. When a person sells a stock short, exchange rules mandate that the order must be identified as a short sale, with statistics on the total number of shares sold short kept by the exchange and released to the public once per month. Short interest for Nasdaq stocks is tallied up by the exchange on the 15th of each month, and that information is disseminated to the public eight business days later. For example, if the short interest is 1,500,000 shares as of August 15th, that information is released to the public on August 27th. Any changes to this number are released one-month later.
The Short Interest Ratio (S.I.R.) is the number of shares sold short (short interest) divided by the average daily volume for the previous month for the particular stock. This number is interpreted as the number of days it would take to cover (buy back) the shares sold short based on the average daily volume. The higher the ratio, the longer it would take to buy back borrowed shares. This often leads to upward momentum for the stock if the sellers became motivated to buy back their short positions. If the stock had a short position of 1,500,000 shares and an average daily volume of 500,000, the S.I.R. would be 3.0, meaning it would take 3 full days of average daily volume for the short sellers to cover their bearish bet. If the stock had average daily volume of just 250,000 shares, the S.I.R. would then be 6.0, meaning it would take 6 days of buying to cover their position. From a contrarian standpoint, a higher S.I.R is desirable because it means it is more difficult to cover the position and the resulting buys have the potential to create significant short term trading profits.
Now that we have a basic understanding of short interest and the short interest ratio, we will now learn how to identify stocks that could be vulnerable to a short squeeze. A Short Squeeze develops when those who sold short the stock, expecting it to decline in price, change their minds about the trade (often because of rising prices) and attempt to cover their position before the market advances and losses accumulate. Short squeezes often occur because of a news event that changes investors’ perception as to the worth of a particular company. A short squeeze can also be created by long holders of the stock attempting to push the price higher, in an attempt to tap into the emotional buying that a trapped short seller can provide. Obviously, if you are short a stock that is advancing, there is a point where it becomes fearful to continue holding a position. With that said, in order to eliminate the mounting losses and the emotional trauma of holding a big loser, the once pessimistic seller will become a panicky buyer. It is this buying that makes the stock advance at a rapid pace.
There are numerous sources for finding information about the number of shares that are short for any individual stock and the corresponding ratio to average daily volume. The site I use most often is www.viwes.com, since this website not only lists the information for individual stocks, but it also has some unique screening features. Below is an example of one such screen. This is often a good place to start your search for stocks that may be vulnerable to a short squeeze because it shows there are fresh shorts in the stock. The professional money manager (usually a hedge fund) who establishes a large short position is typically very disciplined about taking losses and their discipline can often work in our favor. When the stock starts rising, the fund manager will often act quickly to cover their shorts, often they become aggressive buyers in their attempt to minimize losses, this buying can benefit long positions by sending the stock rapidly higher.
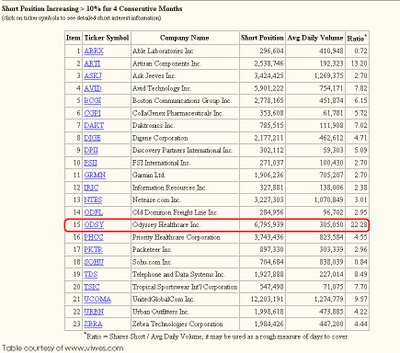
Note: Each of the stocks in the above table has shown an increase in short position of at least 10% for each of the last four months.
In Table 1 (above), we can see the stock with the highest S.I.R. is Odyssey Healthcare Inc. (ODSY) with a S.I.R. of 22.28. Typically any number above 5.0 days to cover is considered a high number. This stock is over four times higher which shows the short sellers may have a difficult time covering their positions without moving the stock highe. This information is a good starting point for finding potential short squeeze candidates because it gives us the answer of who would buy the stock. By recognizing the large short position, we can understand the potential urgency buyers may have in ODSY, which could be a key psychological development behind a buying frenzy in the stock.
In order to whittle the list down further, the stocks charts should be studied to see if there is any technical indication that it might be the proper time for a low risk entry into the stock. Any stock in a downtrend can be immediately eliminated because short sellers are more confident in a position that is moving in their favor. Eliminating situations that are not high probability candidates frees our time to focus on the strong stocks where the short sellers may be in trouble. In order to make this a quick process, I like to look at where the stock is trading in relation to its 50-day moving average (50 DMA). If the stock is below the declining 50 DMA, I will eliminate it from the list and then focus on the stocks that are trading above the rising 50 DMA. A stock that is above a rising 50 DMA is in an uptrend and should be studied further on different timeframes to find where there may be the potential for resistance to halt the upward progress of the stock. If a stock is at a new high, it indicates to me the only source of supply will come from profit takers, rather than people selling to get even on a position they may have been holding in their portfolios at a loss. A stock trading at a new high also indicates it is unlikely that the short sellers are in a profitable position and that may make them more motivated to cover their short position. A chart of ODSY shows the stock trading above the rising 50 DMA, this upward momentum is further confirmed by the fact that as of this writing, May 6th, the stock is trading at an all time high. After I find a stock with a large short position that is losing money in a stock at new highs I want to know the approximate price that the short position was initiated. By understanding how much the short sellers are losing I can monitor the stock for signs they may becoming urgent in their buying.
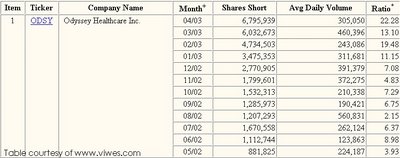
In order to find the information on where the short position was initiated we can look deeper into the short interest tables. By clicking on the symbol “ODSY” we get a new table (Table 2) that shows the current short position and any changes made to that number over the last year. Looking at the information on ODSY we can see that in May 15, 2002, the outstanding short position was just 881,825 shares. As of April 15, 2003, that number was up to 6,795,939 shares sold short and not yet covered. That means between May 15, 2002 and April 15, 2003, 5,914,114 shares were added to the short position in ODSY. The chart shown below (Chart 1) for ODSY shows when the short position changed, this allows us to get a feel for where sellers may be short from. For ODSY, From September 15, 2002 when the stock was trading near $19 to April 15, 2003, the short position grew by 5.2 million shares. All of these shares were sold short below $26, meaning the potential for a squeeze is high because the short sellers are in a losing position and they have to buy back stock to prevent those losses from growing. This puts the short sellers in a very uncomfortable position because they are damned if they don’t do anything and damned if they buy back shares because this will add to the upward momentum they were trying to avoid in the first place, this makes conditions ripe for a short squeeze.

From September 15, 2002 to April 15, 2003, 5.2 million shares of ODSY were sold short. By looking at this information on a chart, we can see that when the stock broke out to new all-time highs in early May, all of those shares sold short were in a losing position, leaving them vulnerable to a short squeeze.
It is important to know that a large short interest ratio by itself is not a reason for buying a stock in anticipation of a short squeeze. As with any other indicator, the short interest ratio should not be used on a stand-alone basis. The informed trader will find an edge when there is a preponderance of indicators leading to a price advance. Short sellers who take large positions are typically sophisticated speculators who have done extensive research on their targeted company and are often right. Many times those who sell short have the right idea fundamentally (examples include names such as Qualcomm, Rambus, Iomega, Presstek, Amazon.com and Krispy Kreme), but their timing could be off. The correct time to sell a stock short is when it is either in, or entering, a downtrend. When a short position is initiated in a stock that is trending higher, there is real potential for big trouble for the shorts. As the stock continues higher in an uptrend, it often becomes tempting to sell short because “it is up too much” or “the P/E is too high”; however, avoiding that temptation and going long is usually the right thing to do until the stock rolls over and shows weakness. Essentially, the potential short squeeze candidate is a security in an uptrend that has attracted a large short interest and has strong fundamentals.
The final, and probably least important, factor to cover in deciding how strong a candidate may be for a short squeeze is the fundamentals of the company. Although poor fundamentals would not preclude a stock from being a potential short squeeze target, a company with strong fundamentals would add to the source of demand that would move prices higher. When looking at fundamentals on a momentum play, it is important not to look too deep. I usually look at the company’s news headlines for sales and earnings information, new product developments and analyst ratings changes. In the case of OSDY, a glance at the headlines shows news reported on May 5, 2003 that reads as follows “Odyssey Healthcare Reports First Quarter 2003 Results; Revenue Increases 50% , Net Income Increases 79%, Company Increases Guidance”. Just reading this headline tells me the company is growing their business by selling more (revenue increase), they are more profitable than they were last year (net income up 79%) and business remains strong (increases guidance). On the day this fundamental news was reported, the stock advanced $.56 on heavy volume, clearly the reaction from Wall Street was a positive one. This news gets me thinking “this is why people will buy this stock”.
When reviewing fundamentals, traders should be more interested in why others would buy or sell. It is important not to make a decision about the company, but only what others may think about the stock. There are may people who buy and sell stocks based on what the prospects for the company are and we cannot ignore them in making our decisions because of their large impact they can have on price.
At the beginning of this article, I stated some of the primary factors that influence stock trading. By walking you through my thinking on ODSY, I hope I have outlined for you how to quickly analyze the fundamental, technical and psychological influences that may come into others decision making. When we have all three of these factors telling us the same conclusion (buy) like we do in ODSY, a trade should be taken which is why as of this writing I am long ODSY. By the time this article is printed I will likely have exited this long position, hopefully with a profit. The one thing I know for certain is that (barring an unforeseen event) I will not take a large loss on the trade. As much as I think it is a good idea to be long ODSY, I realize that the market does not always agree with my analysis and my ego will heal a lot quicker than my equity after a large loss.
In summary, short sellers are usually very savvy speculators; however, like any group of market participants, they aren’t always right. When shorts are wrong about the direction of a stock, the move higher can be dramatic, leading to some excellent short-term profits for traders who see a short squeeze situation developing. Like any indicator, short interest should not be used on a stand-alone basis, but it should become part of a traders’ arsenal. Since technical analysis is largely about measuring supply and demand, short sellers can become an excellent source of demand for a stock at higher prices when the stock is in an uptrend.

