
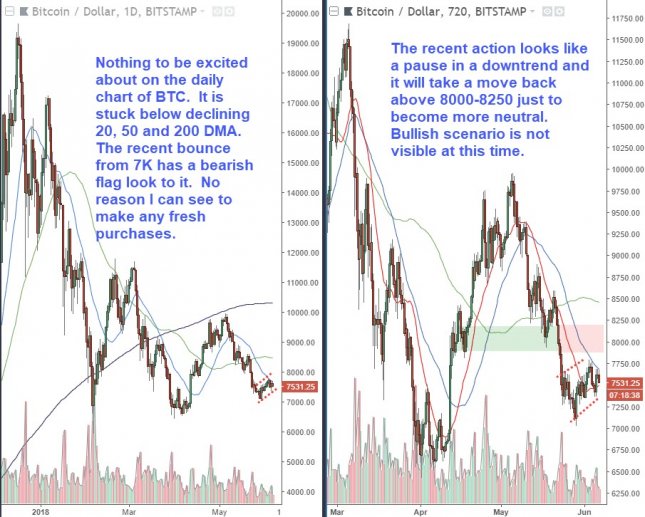
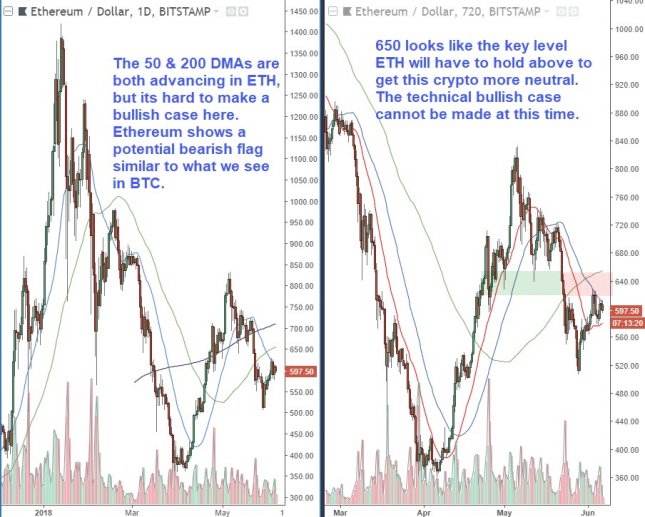
It has been a while since I have updated the Cryptos, so we will look at Bitcoin and Ethereum in the charts below. On the left is a daily chart with a 20, 50 and 200 day moving average and on the right, is a 12-hour chart with a 10, 20 and 50 DMA.
It has been a while since I have updated the Cryptos, so we will look at Bitcoin and Ethereum in the charts below. On the left is a daily chart with a 20, 50 and 200 day moving average and on the right, is a 12-hour chart with a 10, 20 and 50 DMA.

