
When there are no traditional fundamentals to value an asset, technical analysis can provide more insight than people realize. Notice how some simple moving averages and Fibonacci retracement levels have acted as both support and resistance during the recent volatility.
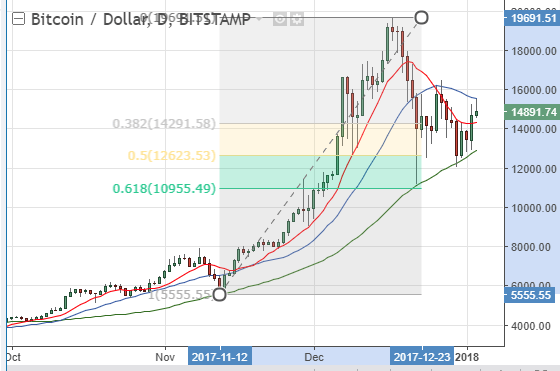
The daily chart above shows how the late December selloff in Bitcoin saw a sharp bounce from the conjunction of the rising 50 day moving average (green MA above) and the 61.8% retracement from the last test of the 50DMA.
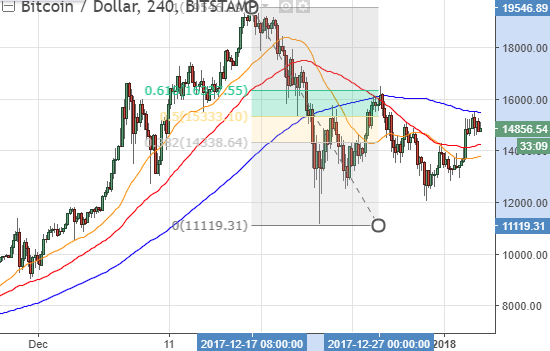
The chart above uses 4 hour candles for a closer look at the recent action. The bounce from the the low 11,000 level brought Bitcoin up to the conjunction of the 20 day moving average (blue MA above) and the 61.8% retracement of the December peak to the selloff low.
Stay tuned to Alphatrends for more regular analysis of Bitcoin and other cryptocurrencies. I will provide general information as well as actionable ideas.

