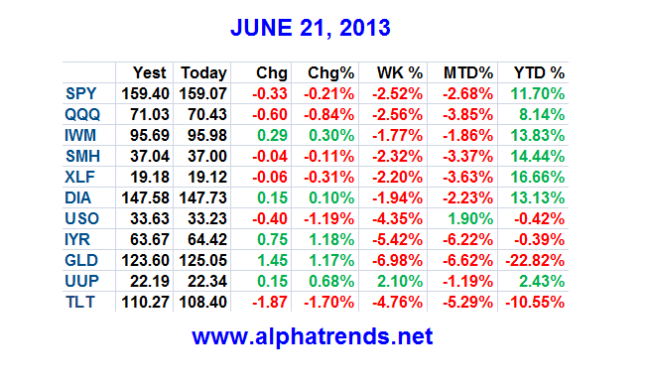
We have observed a range bound market over the last several weeks and have interpreted that as indecision which was a reason to “to be more selective in your trades and reducing position size.” The Fed provided the catalyst for sellers to come in and break the 50 day moving average (more times any support, including moving averages is tested, it is more likely to fail) and continue with the worst bout of selling the market has seen this year.
There has been a lot of damage inflicted on many trends and now we will need time to see if it is capable of healing and heading higher or if it is the start of a bigger decline. The video below takes a look at some important levels of potential support and resistance in $SPY $QQQ $IWM $XLF $SMH $GLD $AAPL
The most likely scenario I see coming in the next week or two is
-a rally to declining 5 DMA and VWAP “since the Fed” which would then act as resistance
-then as the market breaks below the vwap from today’s low a decline down to the YTD VWAP/ Fibonacci levels would unfold.
These levels are discussed outlined in the video.
This is just a potential scenario, not a call. A scenario is not a plan, it is an outline of key levels to be aware of and then to take action around them if the market provides us with a low risk entry level. The markets are dynamic and we have to adjust our thinking when we have new information which is broadcast to us through price change.


