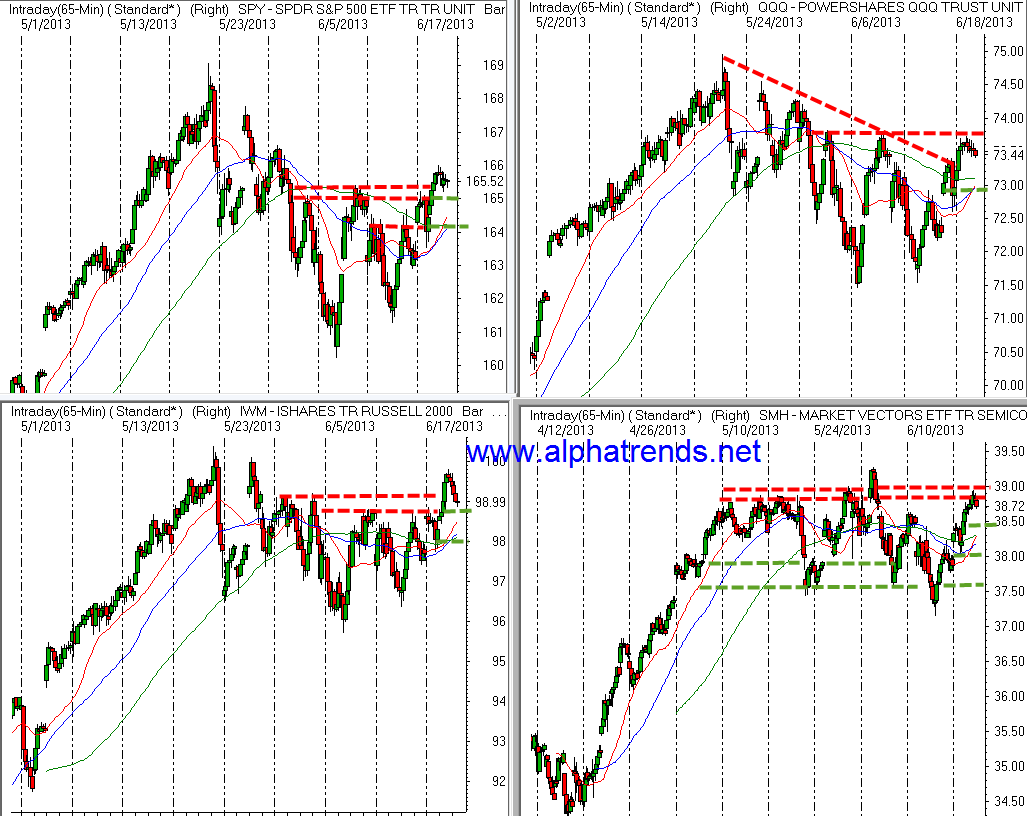
Below are 65 minute charts of $SPY $QQQ $IWM $SMH these charts show 3 different moving averages. Red = 5 dma, Blue = 10 dma, Green = 20 dma All of the moving averages are currently heading higher and that is a bullish sign.
SPY– broke resistance at 165 which should now provide our first level of support, below that the cluster of moving averages near 16425 also like up with prior resistance and would be a secondary level of potential support.
QQQ– rallied up prior resistance at 7375 and a pullback down towards 7300 would actually be good for the market as it would set a higher low from which the market could build energy for a break above 7375
IWM– broke the band of resistance between 9875 and 9910 and now that level is being tested as support. If this level fails to hold, the 9800 area where the rising 10 & 20 dma’s will likely find buyers.
SMH– has been in a bigger range for more than a month and a pullback from this area down towards 3825 would be good to set a higher low from which the market could stage another rally attempt.