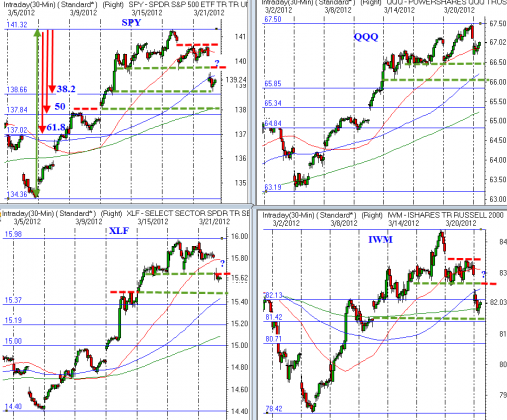
The support in the $SPY has been broken and that market is now below the declining 5 DMA which suggests caution. Fibonacci levels are drawn on all of the charts below and they should be viewed only for “potential levels of support” not a level to buy at. The failure of the $IWM to hold its breakout past the resistance at 83.00 gives us reason for most concern at this time (failed move, fast move?) but the large 81.00 level is still a safe distance away before real trouble might begin.
There is nothing to suggest damage to the trends on the dailyor longer timeframes, however buying blindly into a selloff has never been my preferred approach, we need to let the market establish support on shorter timeframes so we have levels against which to establish stops on new longs.


