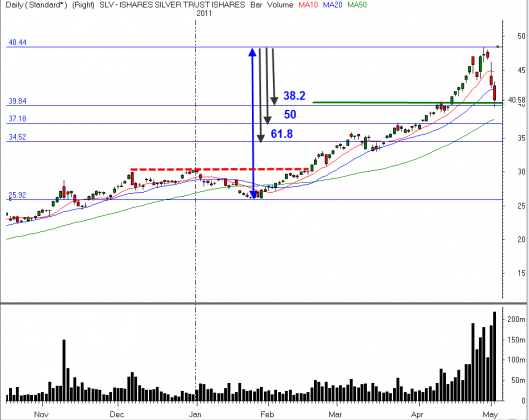
There are a number of technical levels of significance on the $SLV chart below. First we can see the blue arrow which shows the year low to the year high, beside that arrow are three arrows which represent Fibonacci retracement levels. Yesterday, SLV found intraday suport at the 38.2 % retracement level. The question is, will there be continued support there today or will it drop down towards the 50% retracement neaer 37.18? Notice how the 50 day moving average is also in that same general area (currently 37.76)
The other level of significance on this chart is the horizontal green line at approximately40.15. This line represents the volume weighted average price (VWAP) from the February 17 breakout past resistance near 30. So far, the buyers remain in control since that breakout, but that could change quickly now that the market is testing that level. Another level to keep an eye on today if silver is weak would be 38.95 (not shown) which is the approximate VWAP from the late January low to the recent high.
None of these levels should be viewed as solid buy points, one of them may end up being the bounce point in hindsight. For now they are “areas of interest” where we want too look at shorter term charts for evidence that the buyers may be gaining control. Having technical levels to monitor will give you a significant advantage over the “this is down too much, it is ridiculous” crowd who rely on their emotions. Picking a turning point is extremely difficult and risky but there can be significant short term rewards for those who get it right.


