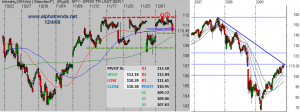
The blue line on the chart 30 minute chart is the VWAP “since Dubai” and with the market below that level, the average long since that event is now losing money. “Since Dubai” isn’t such a big deal, but the 2 failed attempts at breaking past the 111.80 level over the last 2 days does give us reason for more concern, especially when we look at the significance of where we are on the weekly chart (on the right) The SPY has retraced almost exactly 50% of the ’07 high to the ’09 low and the down trendline is also an obvious reference point which is getting a lot of attention. The market seems to be at a crossroads with a lot of short term volatility as larger forces play out. My interpretation of the volatility is to trade smaller size with lower profit expectation and cut losers quicker than usual until there is a clear directional bias that holds for more than a few hours at a time.


