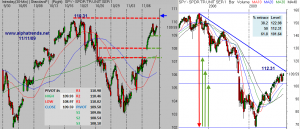
Yesterday’s low came within 5 cents of the pivot before prices recovered in the afternoon and this morning the SPY is trading above the year high of 110.31 which makes it necessary to take a step back and look at the bigger picture (weekly chart on the right) for potential upside levels. The 50% retracement of the 2007 high to the 2009 low is found at 112.31 and that area is also the location of the down trend line which makes it a level where we would expect to find supply if the market can continue higher. We will now look for ~110 to be support and then yesterdays lows near 109 if we get a deeper pullback.


