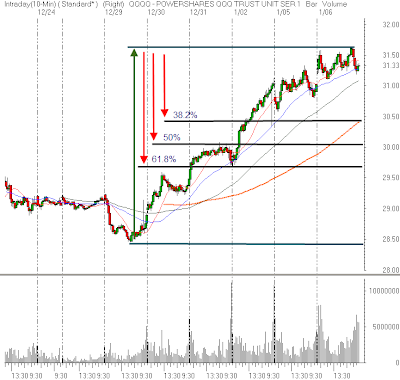
IF this morning’s weakness turns into a buying opportunity, the chart of the QQQQ below shows the fibonacci retracement levels of the recent rally. These are not levels to buy, they are levels to watch the market closely for evidence that buyers are getting involved. If it becomes clear that support is being found then your actions to buy or sell should come from a shorter term timeframe where you can manage risk closely.

Notice that the 38.2% retracement is coincident with the rising 5 day moving average.
Current Moving Averages on Daily Timeframe
10DMA – 29.80
20DMA – 29.81
50DMA – 29.68
.


