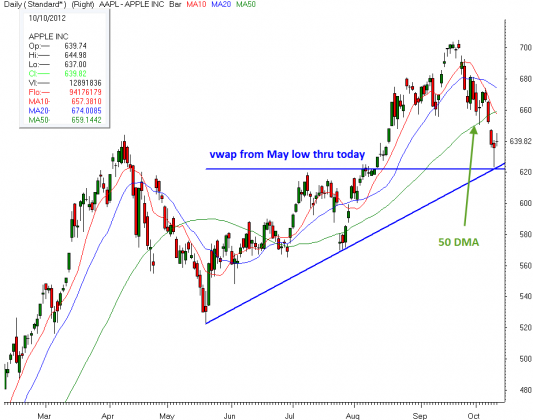
The 50 day moving average is often an area where the market or an individual stock will find support on pullbacks in an uptrend. As I like to point out, a moving average is not a place to buy, but instead to monitor shorter term timeframes for potential support and evidence of a turn. Many people learned the hard way in $AAPL that the support is often, not always found at an important moving average.
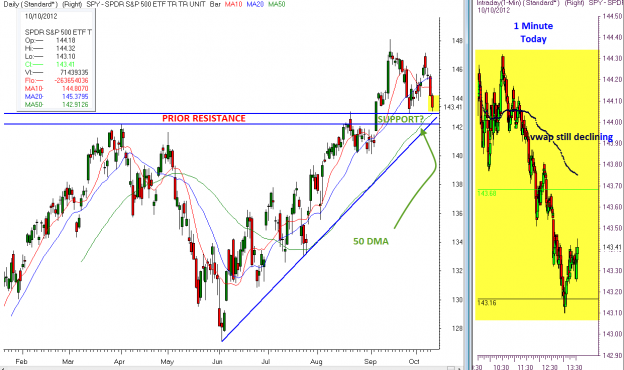
The $SPY has been above the 50 DMA since mid July and now it looks like the market should test that average (currently found at 142.91) Touching the 50 DMA would also undercut the September 26 low of 142.95 and bring the market into a prior “zone of resistance” between 142.25 and 143. It seems like a reasonable scenario that the $SPY may bounce from from somewhere in this area and as such, the short side does not look like a good idea on a break of the prior low. At the same time, blindly buying into a potential support zone does not carry high odds either. The best course of action is to patiently observe the market behavior on shorter term timeframes for signs that buyers are attempting to gain control. For a “bounce trade” it is often best to wait for the volume weighted average price to flatten out and then see a higher high and higher low form on a 1=5 minute timeframe. Reversal trades are difficult and higher risk than trading with the trend but can be very quick gains if you get them right. If you are wrong, have a plan to exit quickly because no one knows for certain where a bottom will be made.


